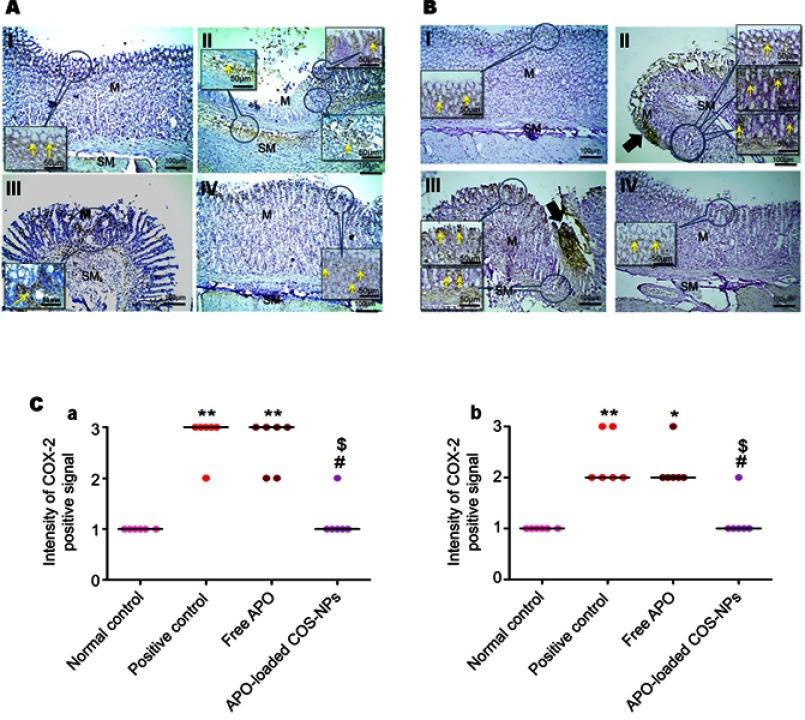
Figure 9.
Positive signal for IHC staining of COX-2 in rats’ gastric tissues following (A) concurrent induction and treatment regimen and (B) post-treatment regimen. Statistical analysis of intensity of COX-2 positive signal in rats’ gastric tissues (C) following (a) concurrent induction and treatment regimen and (b) post-treatment regimen.
Notes: (I) Normal control group, (II) positive control group, (III) free APO treated group, and (IV) APO-loaded COS-NPs (F4) treated group. Oral dose of free or loaded APO was 14 mg/kg. Thick black arrows point to strong COX-2 expression in areas of mucosal necrosis. Yellow arrows in insert point to positive signal. IHC counterstained with Mayer’s hematoxylin, 100× and insert 200×. Kruskal–Wallis test (non-parametric test) was applied followed by Dunn's multiple comparison test. *p<0.05 and **p<0.01 vs normal control group. #p<0.05 vs positive control group. $p<0.05 APO-loaded COS-NPs (F4) treated group vs free APO treated group.
Abbreviations: APO, apocynin; COS, chitosan oligosaccharide; COX-2, cyclooxygenase-2; IHC, immunohistochemical; M, mucosa; NPs, nanoparticles; SM, submucosa.

