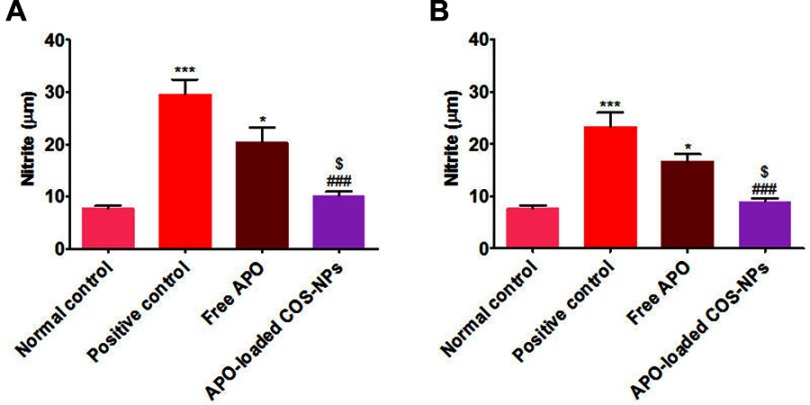
Figure 11.
Levels of NO in rats’ gastric tissues following (A) concurrent induction and treatment regimen and (B) post-treatment regimen.
Notes: Data are mean ± SEM (n=6). *p<0.05 and ***p<0.001 vs normal control group. ###p<0.001 vs positive control group. $p<0.05 APO-loaded COS-NPs (F4) treated group vs free APO treated group.
Abbreviations: APO, apocynin; COS, chitosan oligosaccharide; NO, nitric oxide; NPs, nanoparticles; SEM, standard error of the mean.

