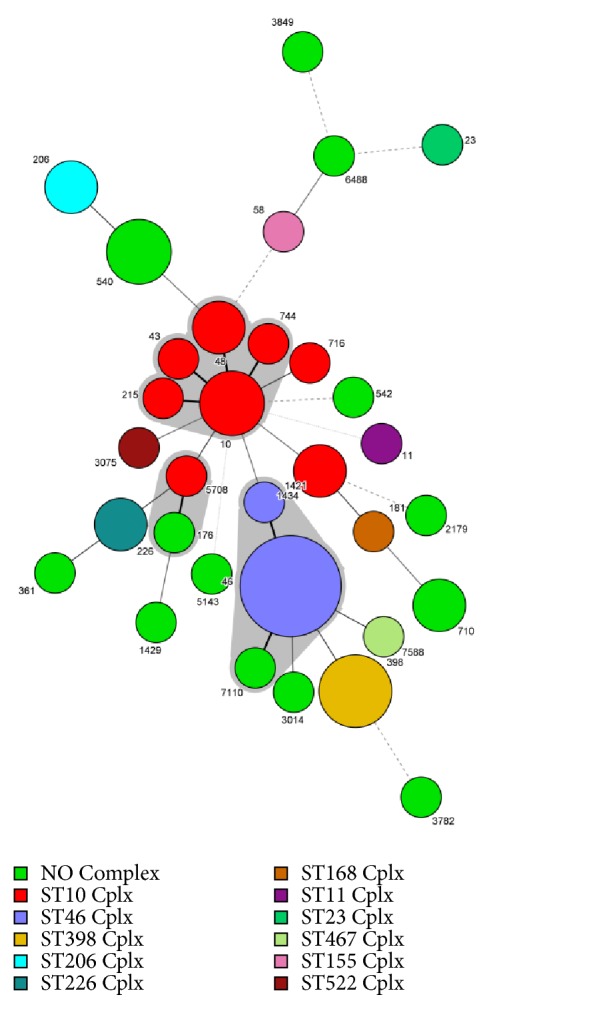
Figure 2.

Minimum spanning tree analysis of E. coli isolated from free-range mink farms. Note. Each circle represents one ST, and the area of the circle corresponds to the number of isolates. The colour of the circle indicates the clonal complex to which the isolate belongs. The grey region indicates that strains of isolates belong to a clonal complex. ST11 is included as a reference.
