
Figure 1.
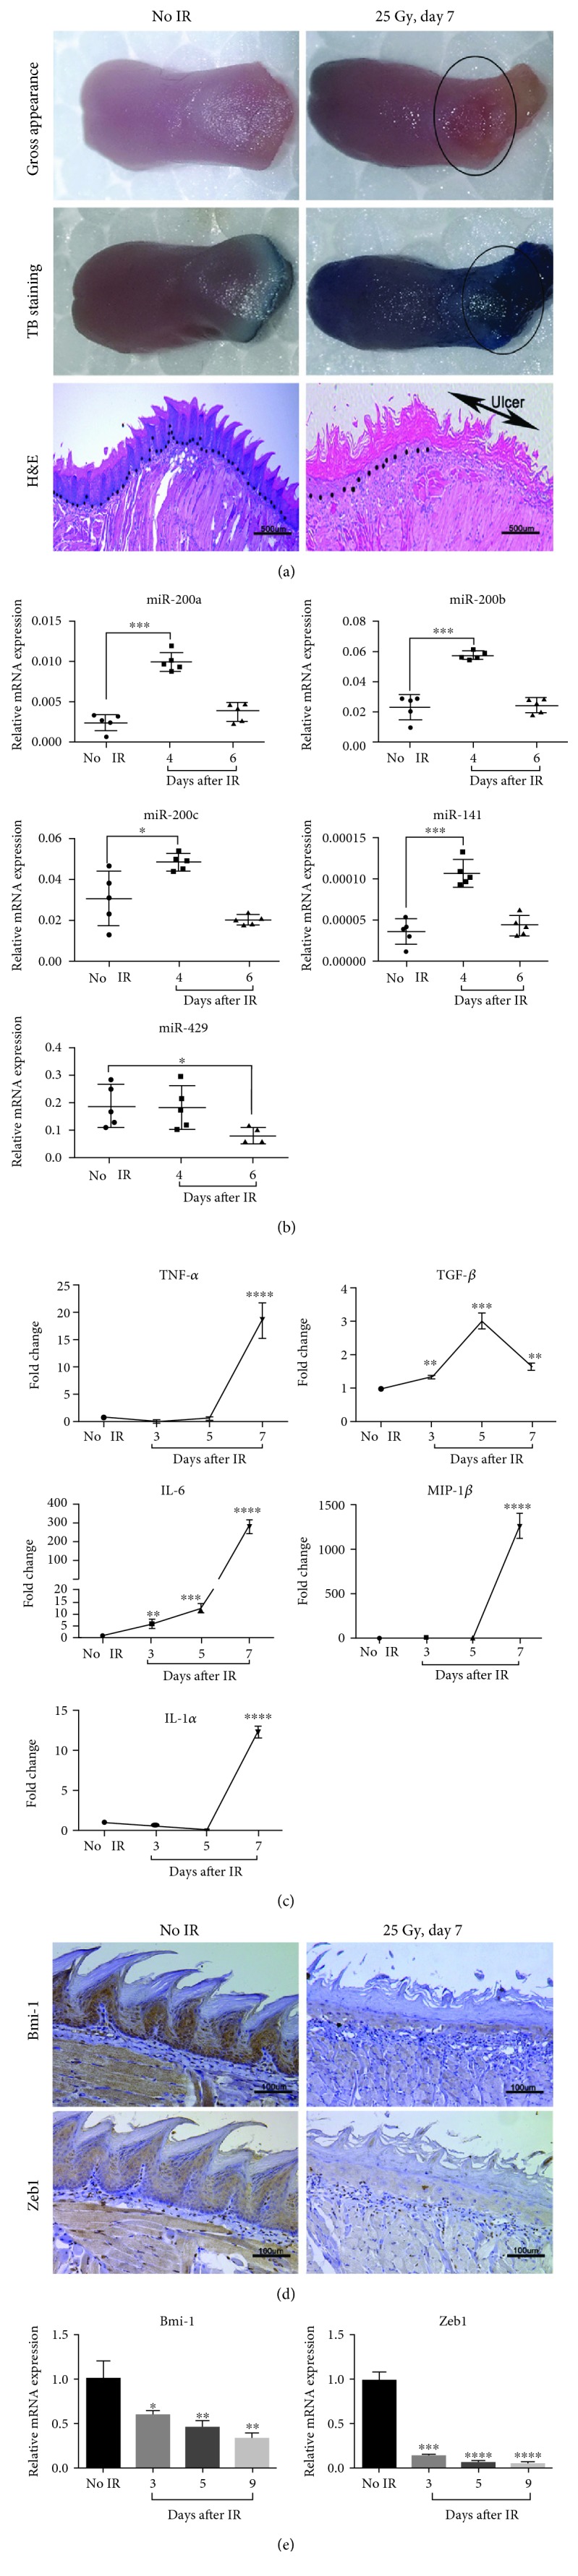
miR-200 family numbers are induced during RIOM. (a) Representative images of RIOM gross appearance, toluidine blue (TB) staining, and HE staining of tongue tissues from nonirradiated and irradiated C57BL/6 mice at day 7 after 25 Gy IR. Arrows show the areas of ulcer. The dot lines refer to epithelial-stromal boundary. (b) The tongues of C57BL/6 mice were harvested at days 0, 4, and 6 postirradiation; the expression level of miR-200 family was measured by qPCR (n = 5 per group). ∗ P < 0.05 and ∗∗∗ P < 0.001 vs. nonirradiated control mice. (c) The tongues of C57BL/6 mice were harvested at days 0, 3, 5, and 7 postirradiation, then the mRNA levels of TNF-α, TGF-β, IL-6, IL-1α, and MIP-1β were measured by qPCR (mean ± S.D.). The proinflammatory cytokines were induced during RIOM formation. ∗∗ P < 0.01, ∗∗∗ P < 0.001, and ∗∗∗∗ P < 0.0001 vs. nonirradiated control mice. (d) IHC staining of Bmi-1 and Zeb1 of tongue tissues from nonirradiated and irradiated mice at day 7 after 25 Gy IR. (e) The mRNA level of Bmi-1 and Zeb1 in the tongues of C57BL/6 mice harvested at days 0, 3, 5, and 9 postirradiation was analyzed by qPCR. ∗ P < 0.05, ∗∗ P < 0.01, ∗∗∗ P < 0.001, and ∗∗∗∗ P < 0.0001 vs. nonirradiated control mice.