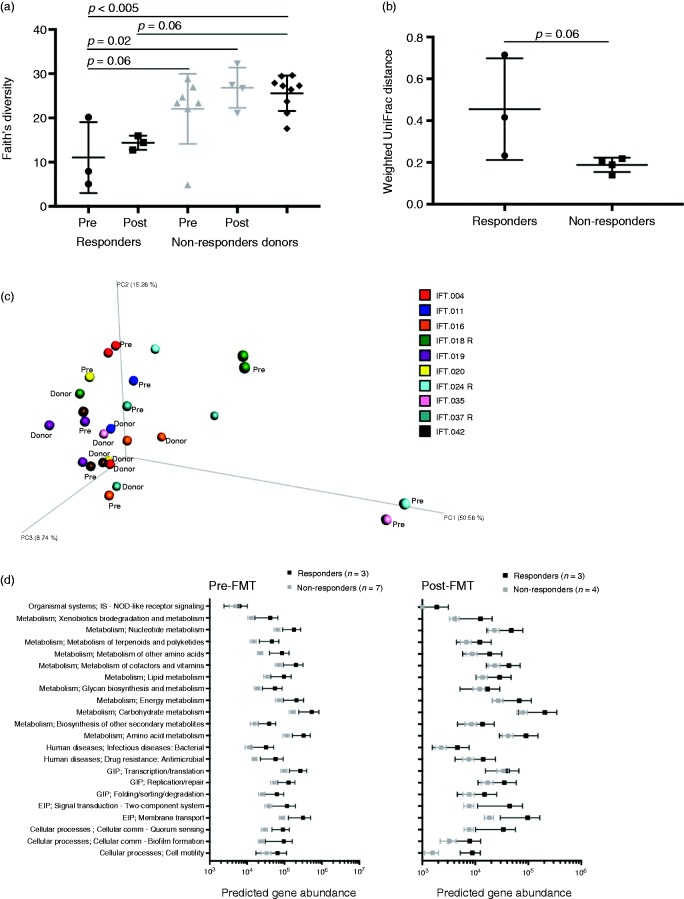
Figure 1.
Bacterial communities of clinical responders changed more following FMT than did nonresponders’ communities. (a) Bacterial alpha diversity of responder, nonresponder pre- and post-FMT, and donor groups. (b) Weighted UniFrac distances between paired pre- and post-FMT samples indicate responders changed marginally more than nonresponders following FMT. (c) Principal coordinate analysis plot showing relative (dis)similarity of individual samples using weighted UniFrac distances with participant identification denoted by color (Pre = pre-FMT sample, R = clinical responder). (d) Predicted functions (Piphillin output summarized at KEGG pathway level 2) of bacteria with significantly different relative abundances in clinically responsive vs nonresponsive patient stool samples pre- or post-FMT. EIP: environmental information processing; FMT: fecal microbiota transplantation; GIP: genetic information processing. Error bars represent SEM.

