Figure 1.

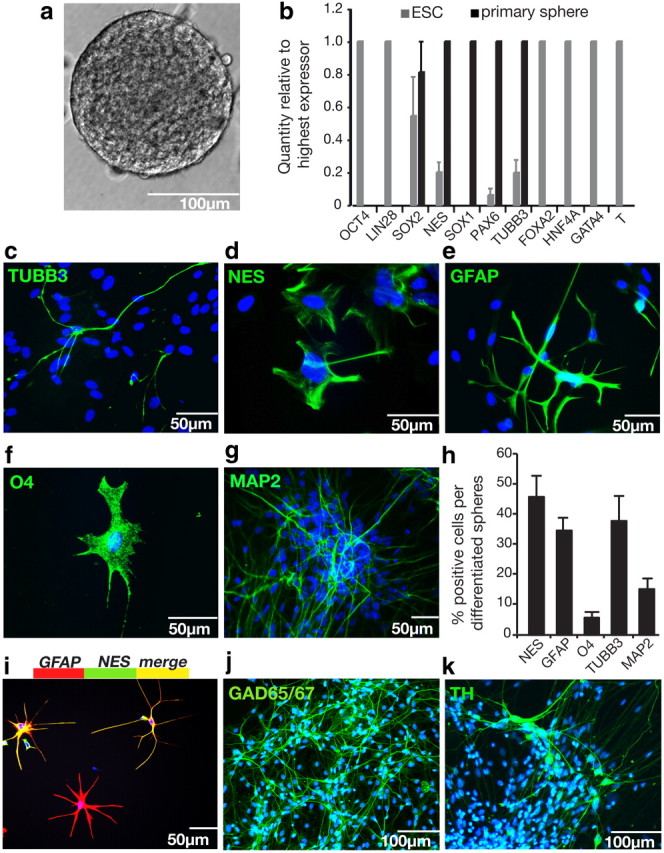
Clonal neurospheres grow in defined conditions over 4 weeks, express only neural markers, and could differentiate into neurons and glia. a, A floating clonal neurosphere at 28 d, grown from a single cell from an hESC colony. b, A comparison of mRNA transcript levels in hESCs versus primary neurospheres by Q-PCR revealed that clonal NSC colonies have an entirely neural phenotype: they express neural markers (NES, SOX1, PAX6, TUBB3) but not pluripotency genes (OCT4, LIN28), endodermal genes (FOXA2, HNF4A, GATA4), or mesodermal genes (GATA1, T), n = 4. c–g, Differentiation potential was assessed by plating single neurospheres on matrigel-coated plates in SFM with 1% FCS for 14 d. Differentiated neurospheres produced TUBB3+ (c) and MAP2+ (g) neurons (shown here growing out of a whole sphere), GFAP+ (e) astrocytes, and O4+ (f) oligodendrocytes, while many cells still expressed the neural precursor marker NES (d). All nuclei were counterstained with Hoechst stain (blue). h, Quantification of marker proteins by ICC show that differentiated cell types consisted of neural precursors (45.9% ± 6.9% NES+), neurons (37.9% ± 8.3% TUBB3+, and 15.2% ± 4.2% MAP2 +), astrocytes (34.7% ± 4.2% GFAP+), and oligodendrocytes (5.8% ± 1.9% O4+). i, A population of differentiating cells colocalize neural precursor marker NES, and astrocyte marker GFAP. Cells were double labeled with GFAP (red) and NES (green) to reveal a population of differentiating cells positive for both proteins (yellow). This overlapping expression accounts for combined marker expression in h being >100%. j, k, Differentiation to 5 weeks produced GABAergic (j) and dopaminergic (k) neurons. Data are represented as mean ± SEM; for Q-PCR, the highest expressing sample (value of “1”) was used as the calibrator.
