Figure 5.
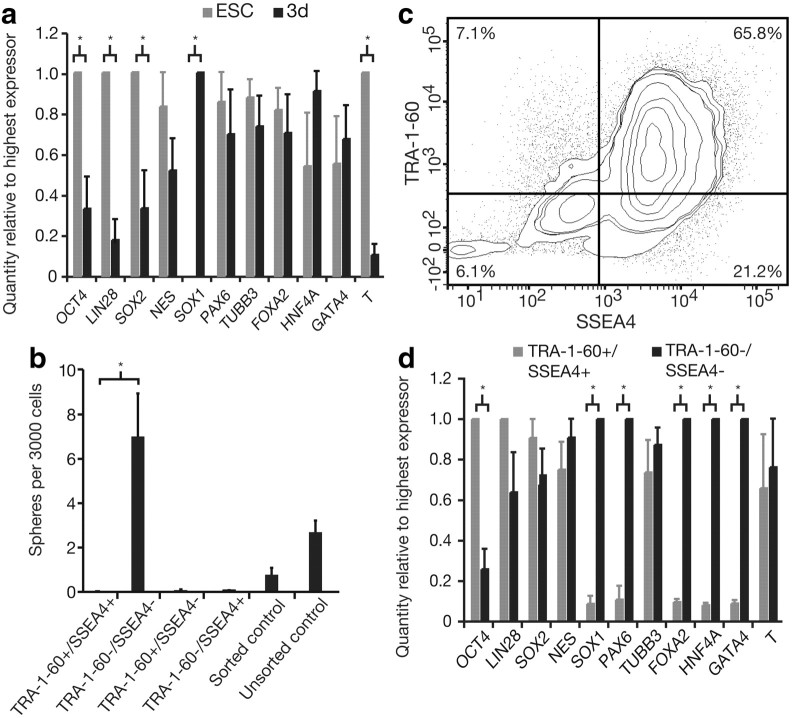
hESCs default to a mixed ectodermal and endodermal identity in SFM alone. Neurosphere-originating cells are TRA-1-60−/SSEA4−, make up 6.14% of cells in confluent colonies, and are characterized by elevated levels of neural and endodermal gene expression. a, A comparison of gene expression by Q-PCR analysis of mRNAs from confluent cells from hESC colonies in maintenance conditions versus single cells from hESC colonies at low density in SFM for 3 d shows that when cells from hESC colonies are free of extrinsic signals their phenotype shifts from pluripotent to mixed endodermal and ectodermal. Two-way ANOVA revealed a significant interaction between gene expression and time in SFM alone (F(10,54) = 8.24, p < 0.0001). Bonferroni post-tests showed a significant decline in pluripotency genes OCT4 (p < 0.01), LIN28 (p < 0.01), and SOX2 (p < 0.05), as well as the mesoderm gene T (p < 0.001), along with a significant increase in expression of the neural gene SOX1 (p < 0.001), n = 4. b, When single cells from hES colonies were sorted on TRA-1-60 and SSEA4 expression and the resulting four fractions were plated at clonal density in SFM plus growth factors, only cells from the double-negative fraction could form neurospheres, indicating that the neurosphere-originating cell in an unsorted population is a TRA-1-60−/SSEA4− cell. One-way ANOVA showed a significant main effect of starting cell population (F(6,34) = 10.06, p < 0.0001), while Bonferroni's post-test revealed a significant difference in the sphere-forming capacity of TRA-1-60+/SSEA4+ cells vs TRA-1-60−/SSEA4− cells (p < 0.05), n = 7. c, FACS shows that a minority of cells in confluent cells from hES colonies are TRA-1-60−/SSEA4− (6.14 ± 1.35%), supporting the idea that neurospheres are arising solely from this fraction. The majority of hESCs in confluent colonies are TRA-1-60+/SSEA4+ (65.78 ± 3.23%), with the remaining 7.12 ± 2.31% being TRA-1-60+/SSEA4−, and 21.24 ± 3.84% being TRA-1-60−/SSEA4+, n = 9. d, A comparison of mRNA transcript levels by Q-PCR in TRA-1-60−/SSEA4− versus TRA-1-60+/SSEA4+ cells showed significant differences in pluripotency, and neural and endodermal gene expression (significant interaction between sorted fraction and gene expression by two-way ANOVA: F(10,58) = 14.67, p < 0.0001). The TRA-1-60−/SSEA4− fraction, which contains the neurosphere-forming cell, is characterized by the significant upregulation of neural genes SOX1 (p < 0.001) and PAX6 (p < 0.001), and endodermal genes FOXA2 (p < 0.001), HNF4A (p < 0.001), and GATA4 (p < 0.001); and downregulation of OCT4 (p < 0.001) (all by Bonferroni post-tests), n = 4. Data are represented as mean ± SEM; for Q-PCR, the highest expressing sample (value of “1”) was used as the calibrator.

