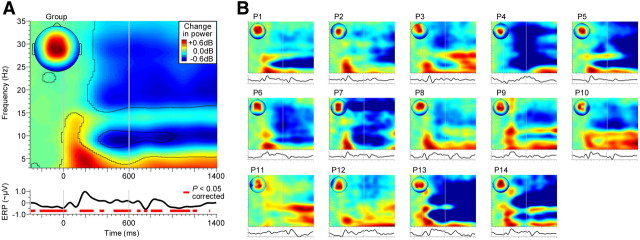
Figure 3.
General effects of auditory stimulation and task. A, Auditory cortical processes were defined by extracting activities that showed a centrally distributed topography and time-locking to the acoustic input and behavioral task [scalp map insert, event-related power spectrum, and event-related activity waveform (ERP), averaged first across the stimulus conditions in Fig. 4 and then across participants; for details, see Materials and Methods]. The time–frequency contours and red horizontal bars delineate significant deviations in EEG power and significant deviations in slow phase-locked activity, respectively, relative to the 500 ms interval before the noise (baseline; p < 0.05, FDR-corrected). Red and blue time-frequency regions indicate power increases and power decreases, respectively. Vertical lines delineate the noise interval (0–600 ms; Fig. 1A). B, Same as A, but for individual participants (P) (without statistics; plots normalized with respect to their maximum).

