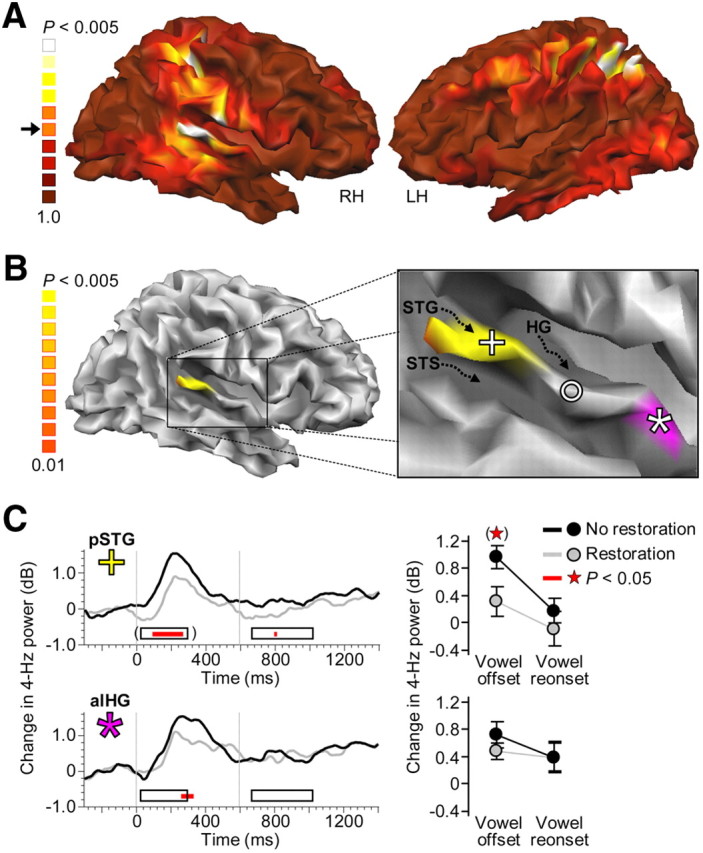
Figure 6.

Cortical origin of the restoration-related suppression. A, Auditory restoration was accompanied by partial suppression of 4 Hz power, specifically in the right temporal cortex and the parietal cortices. Brighter spots in the nonthresholded maps indicate EEG sources exhibiting stronger suppression. Arrow, p < 0.05; LH, left hemisphere; RH, right hemisphere. B, The most significant suppression in temporal cortex was localized in a posterior portion of STG (cross; p < 0.005, excluding vertex clusters <75 mm2). This region was in the vicinity of a region that showed a corresponding effect for the restoration of a simple tone (p < 0.001; circle) in an accompanying EEG study (Riecke et al., 2009b). The red patch delineates the alHG that showed a corresponding effect for restored vowels (p < 0.05) in a similar fMRI study (Riecke et al., 2011a). STS, Superior temporal sulcus; HG, Heschl's gyrus. C, Suppression in posterior portion of STG (pSTG) affected the vowel offset response and also the vowel reonset response as similar trends could be observed during the intervals of these responses (top, event-related 4 Hz power series and time-averaged 4 Hz power). Suppression in alHG revealed a similar and less prominent pattern (bottom). Error bars indicate SEM across participants.
