Figure 7.
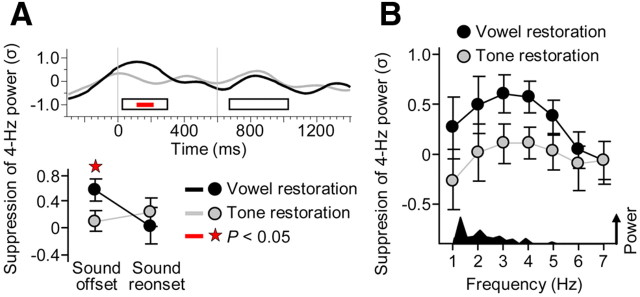
Effects of the restored sound on neural suppression. A, The waveforms show the evolution of restoration-related suppression, defined as the difference in 4 Hz power between the Restoration and No-restoration conditions. The suppression that accompanied the restored vowel revealed peaks during the intervals of the offset/onset responses in Figure 5A (black waveform). A similar pattern was observed for the restoration of a simple tone (gray waveform). Offset suppression was significantly stronger for the restored vowel than the restored tone (p < 0.05). B, The vowel offset suppression (black circles) was reflected most strongly by activities within the lower theta range (3–4 Hz). A similar pattern was observed for the restored tone (gray circles). The offset suppression was reflected less clearly at the peak frequency of the vowel envelope spectrum (1.3 Hz; see amplitude modulation spectrum, bottom) indicating little suppression of sound envelope-locked neural activity. Error bars indicate SEM across 10 participants.

