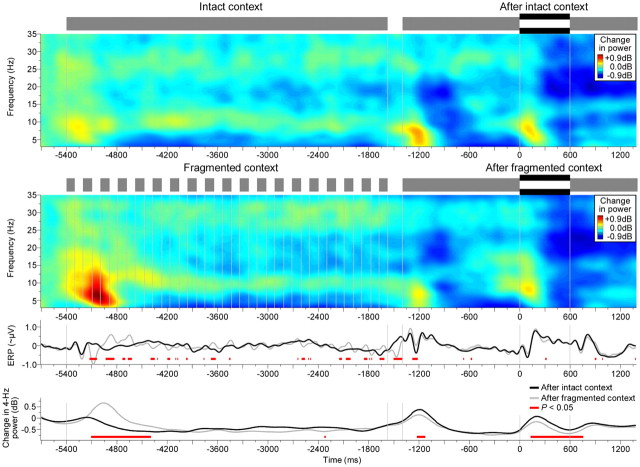
Figure 8.
Effects of auditory context. Same as first through fourth rows in Figure 5C, but plotted across a longer (whole-trial) interval and using the 500 ms interval preceding the contextual stimulus as baseline. Four Hertz power showed context-specific differences, i.e., differences that reflected the gaps in the fragmented context (fourth row). An initial increase was observed shortly after the onset of the fragmented context; this increase decayed over the remainder of the contextual stimulus. Then, during the subsequent probe, a decrease was observed shortly after the probe onset and also shortly after the probe offset at the interruption (p < 0.05; red horizontal bars). Thus the fragmented context exhibited suppressive aftereffects that were time-locked to sound onsets/offsets. Vertical lines denote sound onsets and offsets.

