Figure 6.
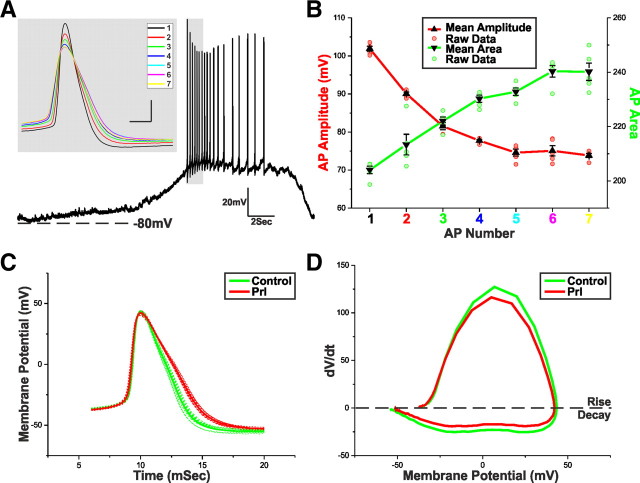
Prl broadens TIDA APs. A, Current-clamp recording of a TIDA neuron up state. Gray inset, An expanded superimposition of the first seven peak-aligned APs demonstrating variation in waveform properties. B, Mean ± SEM of the AP amplitude (red) and AP area (green) of the first seven APs of five consecutive up states from five different TIDA neurons. Amplitude and area achieved statistical significance compared with AP1 from AP2 onward. C, Average AP waveforms from a TIDA neuron in control (green) and Prl (red; 500 nm; n = 10). Raw data used to produce averages shown as dashed lines. To control for the variation in AP properties, only groups with statistically similar amplitudes and thresholds were used for analysis. Note the Prl-induced broadening of the AP. D, Phase plots of the average AP waveforms depicted in C. Note the Prl-induced changes in rise and decay.

