
Figure 1.
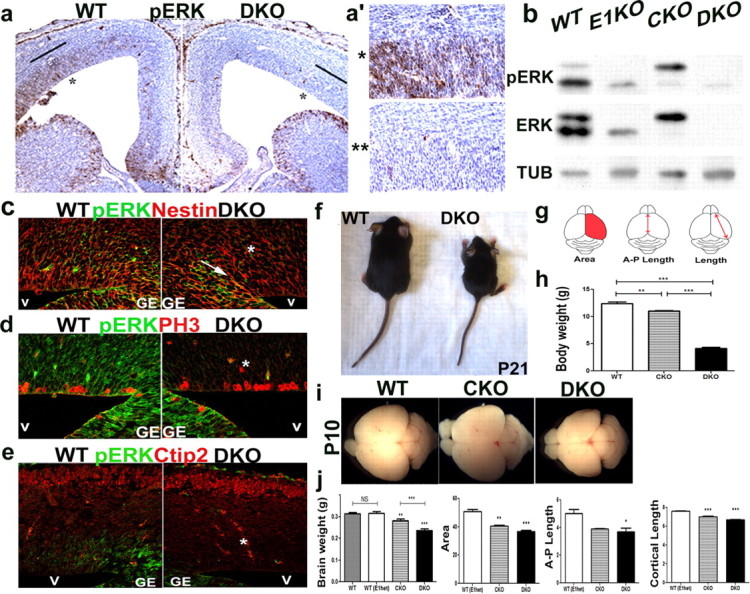
ERK activity is abrogated in the dorsal telencephalon of ERK1 and ERK2 DKO mice. ERK2 inactivation is driven by the Emx1-cre within the dorsal telencephalon beginning at E9.5 (Gorski et al., 2002). a, pERK activity in the developing WT cortex shows low-medial to high-later gradient in the dorsal telencephalon at E14.5. a,a′, ERK activity is lost in the DKO mice at E14.5 as shown by DAB staining, where a′ shows higher magnification of the telencephalon marked in a. b, Western blot analysis of cortical lysates at E14.5 shows absence of ERK1 and/or ERK2 protein in CKO and DKO mice, respectively. c–e, ERK activity was analyzed by immunohistochemical analysis of pERK expression (green) in DKO mice at E14.5. During midneurogenesis, pERK activity was detected within the proliferative zone of the lateral cortex, but not in the postmitotic neurons. Strong expression of ERK activity was detected in subpallial ventricular zone mitotic progenitors in both WT and DKO cortices, but absent from pallial mitotic PH3+(red) (d) and Nestin+(red) (c) progenitors (asterisk). A clear boundary of cre expression is observed in the DKO mice and marked by an arrow (c). v, ventricle; GE, ganglionic eminence. f–j, The cortical size and body weight is reduced in the ERK2 CKO and DKO mice. Dorsal view of WT and DKO mutant mice at P21 (f). Body weight was measured in CKO (n = 5; p ≤ 0.001) and DKO (n = 5; p ≤ 0.0001) mice and compared with WT (n = 11) (h). Schematic representation of cortical parameters measured: area size, A-P length and cortical length (g). Dorsal images of whole brains: WT (left), CKO (middle), and DKO (right) mice at P10 (i). Quantitative comparison of brain weight and cortical size between WT, CKO, and DKO mice at P10 (j). Measurements of cortical parameters (g) were obtained using ImageJ software. At least six brains were analyzed per genotype.