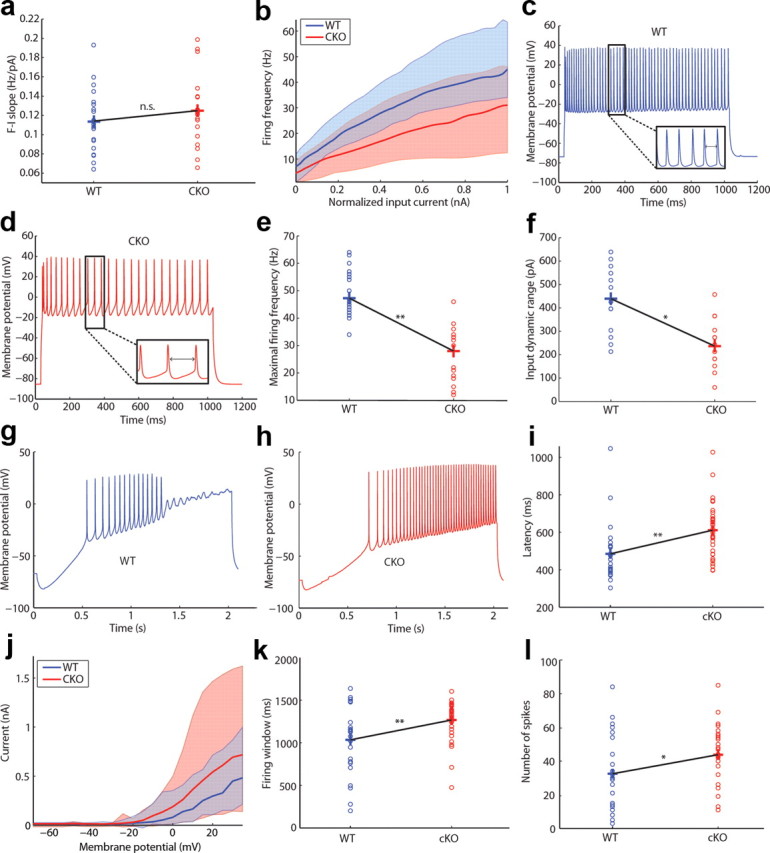
Figure 8.

Cell-intrinsic electrophysiological parameters are altered in Erk2 mutant mice. a, F–I curve slope distributions from layer II/III PCs (WT, n = 21; CKO, n = 18; p > 0.05, bootstrap analysis). Crosses connected by black lines demarcate means of the distributions. b, Median firing F–I current curves with shaded regions representing the area between the 1 and 99% confidence levels. c, d, Examples of layer II/III PCs firing at maximal rates from WT (n = 21) (c) and ERK2 (n = 18) CKO (d) mice. e, Maximal firing frequency distributions (**p < 0.05, bootstrap analysis). Distributions of input dynamic range, defined as the range of input current values between firing onset and maximal firing frequency (*p < 0.05, bootstrap analysis). g, h, Examples of voltage responses to ramp current stimulation in layer II/III PCs from WT (n = 24) (g) and Erk2 (n = 35) CKO (h) mice. i, Latency to the first spike after stimulation with a ramp current (**p < 0.05, bootstrap analysis). j, Median transient outward K+ current with shaded regions representing the area between the 1 and 99% confidence levels (WT, n = 25; CKO, n = 31). k, Number of spikes fired per ramp (*p < 0.05, bootstrap analysis). l, Firing window, defined as time elapsed between first and last spike during ramp current stimulation (**p < 0.05, bootstrap analysis).
