
Figure 9.
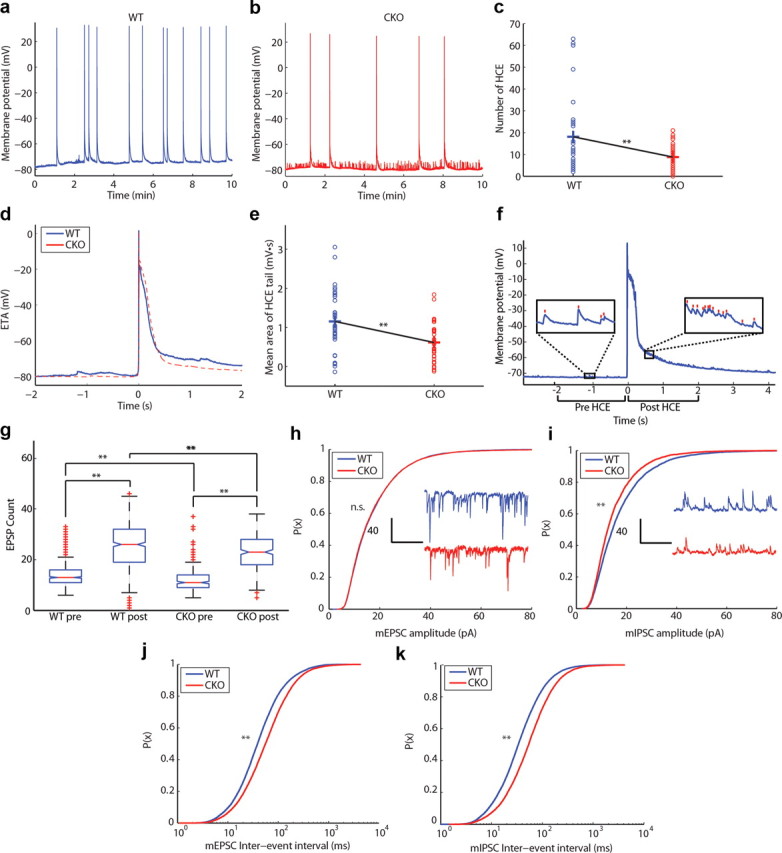
Network-level electrophysiological parameters are altered in ERK2 mutant mice. a, b, Examples of spontaneous network activity (i.e., HCEs) shown as voltage traces in (a) WT and (b) CKO disinhibited cortical slices. c, Number of spontaneous HCEs recorded during a 10 min interval (WT, n = 33; CKO, n = 32; **p < 0.05, bootstrap analysis). d, Event-triggered average (ETA) taken as the mean shape of the network burst. e, Mean area under the HCE tail in relation to the resting potential (**p < 0.05, bootstrap analysis). f, Example of a network HCE recorded in layer II/III PC from a cortical slice of a WT mouse. Note the difference in number of EPSPs 2 s before the HCE (pre-HCE) and 2 s after HCE onset (post-HCE). Insets show EPSPs detected using a custom detection algorithm. Red lines over the voltage trace represent detected EPSPs during the pre-HCE and post-HCE periods. g, Box plot of EPSPs detected during the pre-HCE and post-HCE periods in WT and CKO animals. Red lines and crosses on the box plots represent the distribution means and outliers, respectively. h, Cumulative distribution function of mEPSC amplitude with insets showing sample mEPSC traces (WT, n = 25; CKO, n = 23; p > 0.05, two-sample Kolmogorov–Smirnov test). i, Cumulative distribution function of mIPSC amplitude with insets showing sample mIPSC traces (p < 0.05, two-sample Kolmogorov–Smirnov test). j, Cumulative distribution function of mEPSC interevent interval (**p < 0.05, two-sample Kolmogorov–Smirnov test). k, Cumulative distribution function of mIPSC interevent interval (**p < 0.05, two-sample Kolmogorov–Smirnov test).