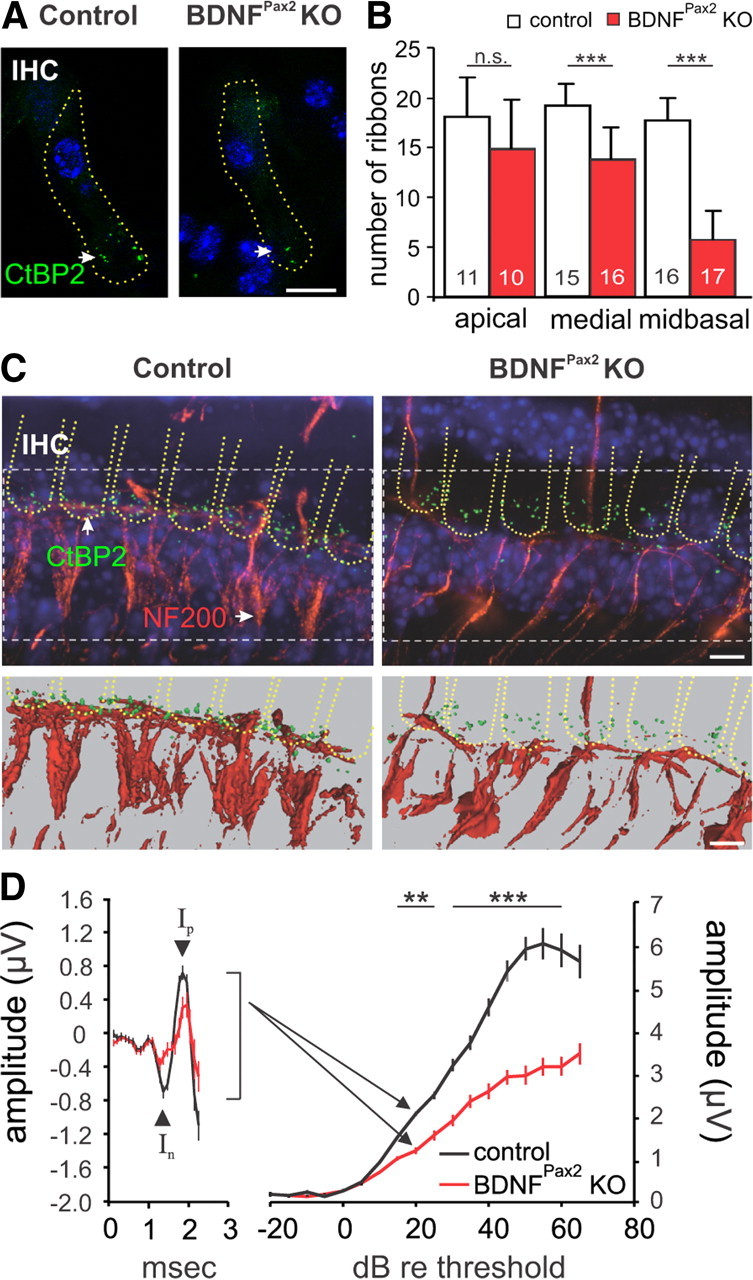
Figure 4.

Reduced synaptic ribbons and fibers in BDNFPax2 KO mice. A, Immunohistochemistry for CtBP2/RIBEYE (green) in controls and BDNFPax2 KO mice, shown for the midbasal turn. Cell nuclei were counterstained with DAPI; scale bar, 10 μm. B, Ribbon counts ± SD in different cochlear turns (t test: p < 0.001). Numbers of IHCs counted are given in the bars; n = 3 mice. C, Whole mount preparation of the medial turn in controls and BDNFPax2 KO mice labeled with antibodies against CtBP2/RIBEYE (green) and NF200 (red; top). Cell nuclei were counterstained with DAPI; scale bar, 5 μm. The lower panel displays isoprojections for the different labelings of the upper panel. D, Reduction of ABR wave I amplitude at 20 dB above hearing threshold (left) and growth function (right) in BDNFPax2 KO mice compared with control, mean ± SEM. Controls: n = 17/34 mice/ears; BDNFPax2 KO: n = 17/34 mice/ears; two-way ANOVA: p < 0.001.
