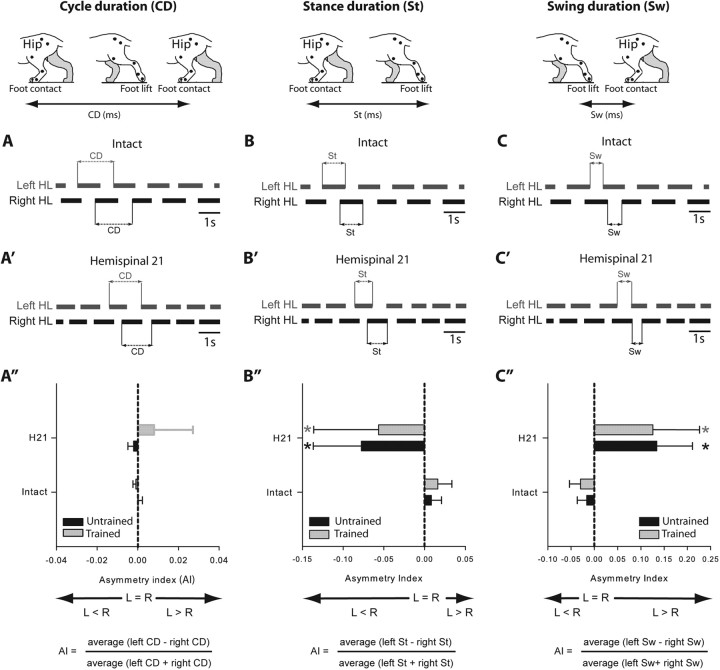
Figure 3.
Comparison, in the two hemisected groups, of the step cycle structure during treadmill locomotion at 0.4 m/s at the intact state and 21 d after hemisection. A–C′, Duty cycles (black horizontal bars) illustrate the support periods (stance) of each limb. Schematic illustration of changes in cycle (A, A′), stance (B, B′), and swing duration (C, C′) in the left and right hindlimbs in the intact and hemispinal state. Comparison of the mean AI between groups calculated for cycle duration (A″), stance duration (B″), and swing duration (C″). *p < 0.05, statistical differences between the preoperative and postoperative values. L, Left; R, right.

