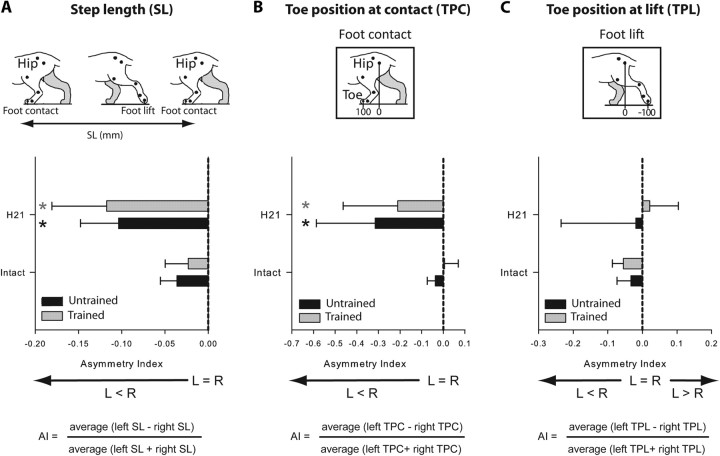
Figure 4.
Comparison, in the two hemisected groups, of step length and paw placement during treadmill locomotion at 0.4 m/s at the intact state and 21 d after hemisection. Comparison of the mean AI between groups calculated for step length (A) and toe position at contact (B) and lift (C). *p < 0.05, statistical differences between the preoperative and postoperative values. L, Left; R, right.

