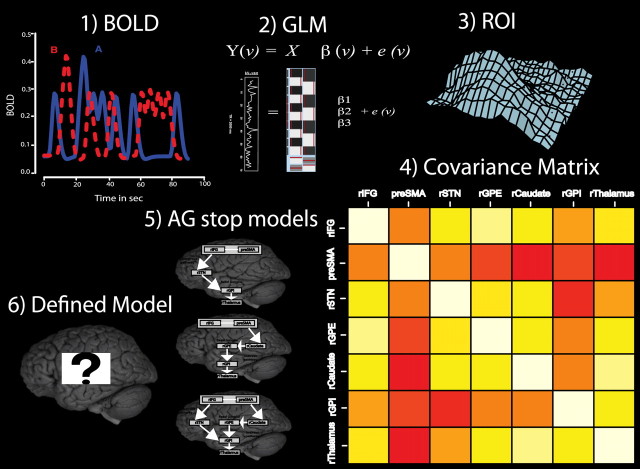
Figure 2.
Graphical representation of all ancestral graphs connectivity steps. (1) The event-related BOLD measurements are used as inputs to (2) the general linear model (GLM). (3) The seven structural fronto-basal ganglia ROIs (rIFG, pre-SMA, rSTN, rCaudate, rGPI, rGPE, rThalamus) determine the number of nodes in the ancestral graph and are used to determine the amplitudes for each trial separately for each region, such that (4) the covariance matrix for these regions can be determined based on single-trial data. (5) The data covariance matrix for each condition is then compared with all defined ancestral graph models, and each model obtains a BIC score. (6) The model with the lowest BIC values represents the group network best and is selected.

