
Figure 2.
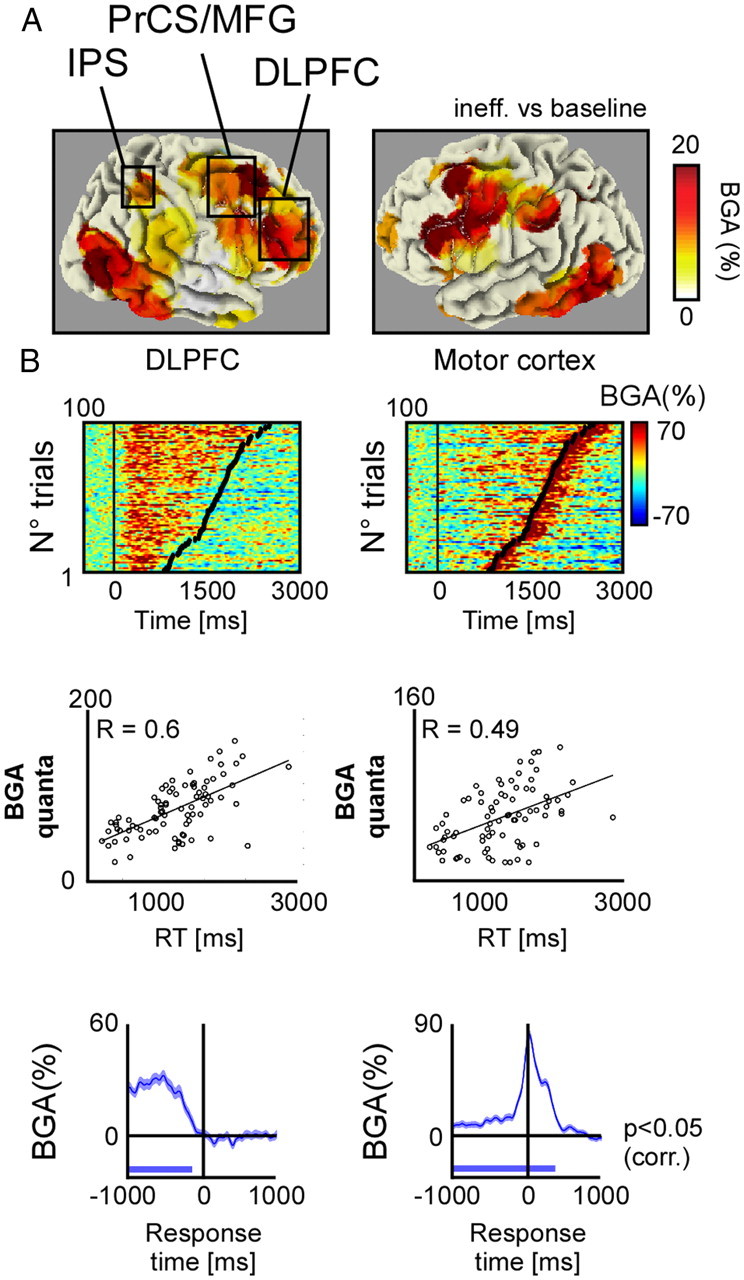
Broadband gamma activity response patterns during visual search. A, Grand average broadband gamma response topography across all recording sites and all patients, plotted on a “glass brain” in MNI coordinates. B, Top, Single-trial BGA responses recorded from DLPFC (left, Talairach coordinates [−37 17 27]) and primary motor cortex (right, Talairach coordinates [−57 −28 48]) from patient 23 in the inefficient search condition. Middle, Scatter plot of single-trial BGA quanta versus reaction times. A BGA quantum is a significant time-sample of BGA response versus baseline power evaluated between stimulus onset and offset (Wilcoxon test, FDR corrected). Left and right panels correspond to upper BGA responses. C, Average BGA responses aligned to the response (button-press). Left and right panels correspond to top panel BGA responses.