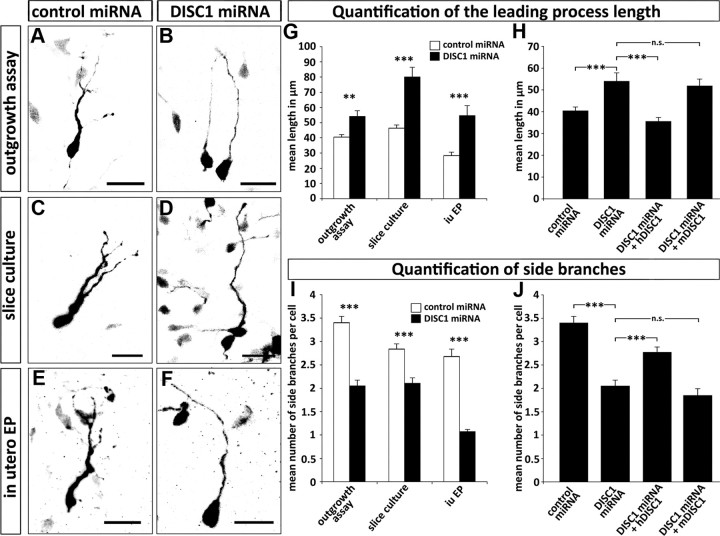
Figure 5.
DISC1 knockdown leads to alterations in the morphology of MGE-derived interneurons. A–F, Photomicrographs of cells transfected with control miRNA or DISC1 miRNA in outgrowth assays (A, B), slice cultures (C, D), and after in utero electroporation (iu EP) (E, F). G–J, Quantification of cell morphology. Under all experimental conditions, DISC1-deficient cells show longer, but less branched leading processes (G, I). Cotransfection of miRNA with mDISC1 or hDISC1 in the outgrowth assay shows that the effect of DISC1 knockdown can be rescued by a miRNA insensitive DISC1 (H, J). For statistical analysis, the means were compared with a Student's t test. Outgrowth assay: leading process length: control miRNA, 41 ± 2 μm; DISC1 miRNA, 54 ± 4 μm; DISC1 miRNA + mDISC1, 52 ± 3 μm; DISC1 miRNA + hDISC1, 36 ± 2 μm; number of side branches: control miRNA, 3.4 ± 0.1; DISC1 miRNA, 2.1 ± 0.1; DISC1 miRNA + mDISC1, 1.85 ± 0.15; DISC1 miRNA + hDISC1, 2.77 ± 0.11; control miRNA, n = 127 neurites from 30 cells; DISC1 miRNA, n = 60 neurites from 30 cells; DISC1 miRNA + mDISC1, n = 33 neurites from 21 cells; DISC1 miRNA + hDISC1, n = 71 neurites from 24 cells. Slice culture: leading process length: control miRNA, 46 ± 2 μm; DISC1 miRNA, 80 ± 6 μm; number of side branches: control miRNA, 2.8 ± 0.1; DISC1 miRNA, 2.1 ± 0.1; control miRNA, n = 92 neurites from 30 cells; DISC1 miRNA, n = 66 neurites from 30 cells. In utero electroporation: leading process length: control miRNA, 28 ± 2 μm; DISC1 miRNA, 55 ± 7 μm; number of side branches: control miRNA, 2.7 ± 0.2; DISC1 miRNA, 1.1 ± 0.1; control miRNA, n = 53 neurites from 18 cells; DISC1 miRNA, n = 28 neurites from 26 cells). ***p < 0.001; **p < 0.01; n.s. p > 0.05, t test. Scale bars, 20 μm. Error bars are SEM.

