Figure 6.
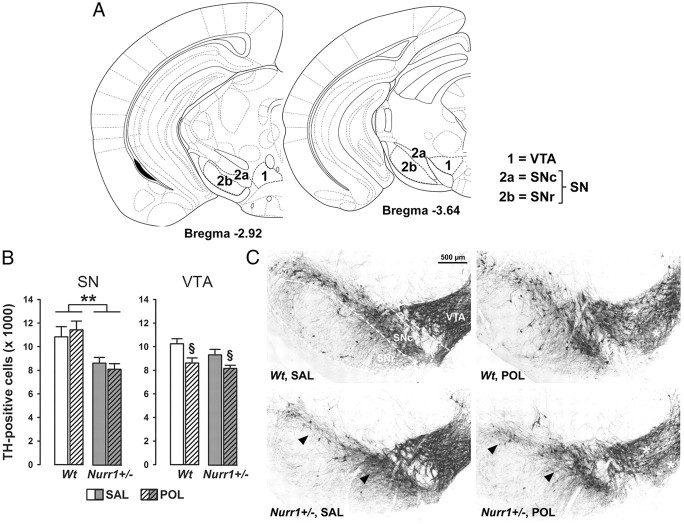
Independent effects of prenatal immune activation and genetic Nurr1 deficiency on midbrain dopamine cell numbers. A, Schematic coronal brain sections delineating the ventral midbrain areas investigated with reference to bregma [adapted from The Mouse Brain in Stereotaxic Coordinates by Franklin and Paxinos (2008)]. Dopaminergic midbrain cells were quantified in sections ranging from bregma −2.92 to −3.64 mm. 1, VTA; 2a, SNc; 2b, SNr. B, Stereological estimates of TH-positive cells in the SN and VTA of adult wt and Nurr1+/− offspring subjected to prenatal poly(I:C) (POL) (2 mg/kg, i.v.) or vehicle [saline (SAL)] on gestation day 17. Stereological estimates in the SN took into account TH-positive cells in both the SNc and SNr. **p < 0.01 and §p < 0.05, signifying the main effects of genotype and prenatal treatment, respectively. N = 7 males in each experimental group; all values are means ± SEM. C, Coronal brain sections of representative SAL- or POL-exposed wt and Nurr1+/− offspring stained with anti-TH antibody. The sections highlight the SN and VTA regions as indicated by the dashed lines. Note the decrease of TH-positive cell bodies in the SN of SAL- or POL-exposed Nurr1+/− offspring (indicated by the arrowheads), and the reduction of TH-positive cells in the VTA of POL-treated wt or Nurr1+/− offspring (indicated by the white stars).

