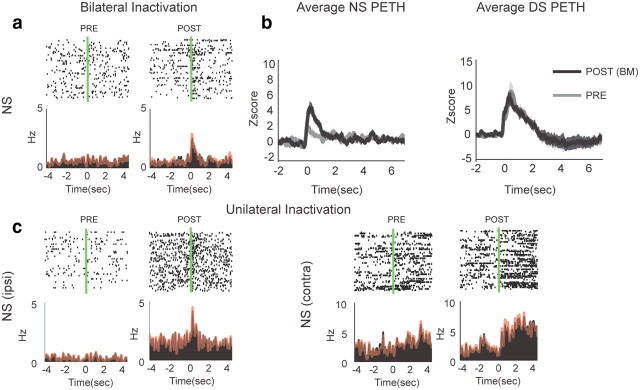
Figure 6.
Encoding of neutral stimuli in NAcS before and after vmPFC inactivation. a, Example neuron showing emergent NS excitation following bilateral vmPFC inactivation. Overlaid red line shows the PETH made from the NSs not followed with a behavioral response. b, Average z-scores of NS PETHs for neurons showing emergence or significant increase in excitations to NS before (gray) and after (black) vmPFC inactivation and average z-scores of DS PETHs for the same group of neurons. c, Example neurons showing emergent NS excitation following ipsilateral or contralateral vmPFC inactivations. Overlaid red line shows the PETH from NS not followed with a behavioral response.

