Figure 14.

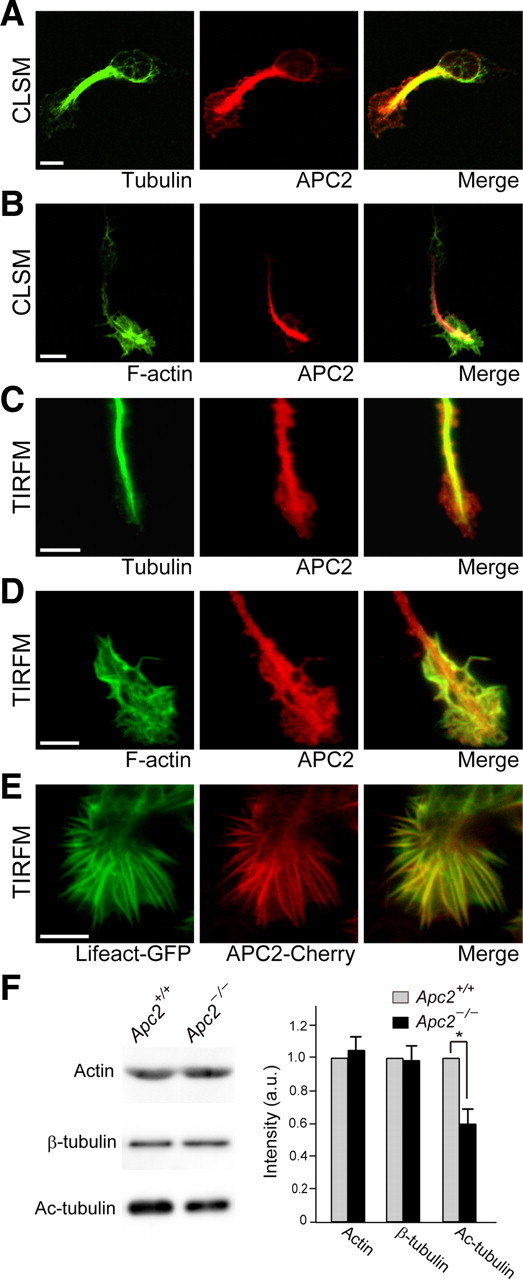
Distribution of APC2 along microtubules and actin fibers and destabilization of microtubules in Apc2-deficient CGCs. A, B, Distribution of APC2 in cultured CGCs examined by a confocal laser scanning microscope (CLSM). APC2 was well colocalized with microtubules both in the cell soma and at the leading edge (A). On the other hand, APC2 partially colocalized with F-actin in the leading edge (B). C, D, Distribution of APC2 at the leading edge of cultured CGCs examined by a TIRFM. Signals for APC2 were observed along microtubules in the shaft of the leading edge (C). On the other hand, APC2 was well colocalized with F-actin at the periphery of the leading edge (D). E, TIRFM observation of a HEK293T cell coexpressing APC2-mCherry and Lifeact-EGFP, which visualizes F-actin. Scale bars, 5 μm. F, Western blot analyses of cytoskeletal proteins in extracts of wild-type and Apc2-deficient CGCs. Signal intensities were quantified and summarized. Values are shown as the mean ± SEM. The asterisk indicates a significant difference between the two genotypes by Student's t test (*p < 0.05).
