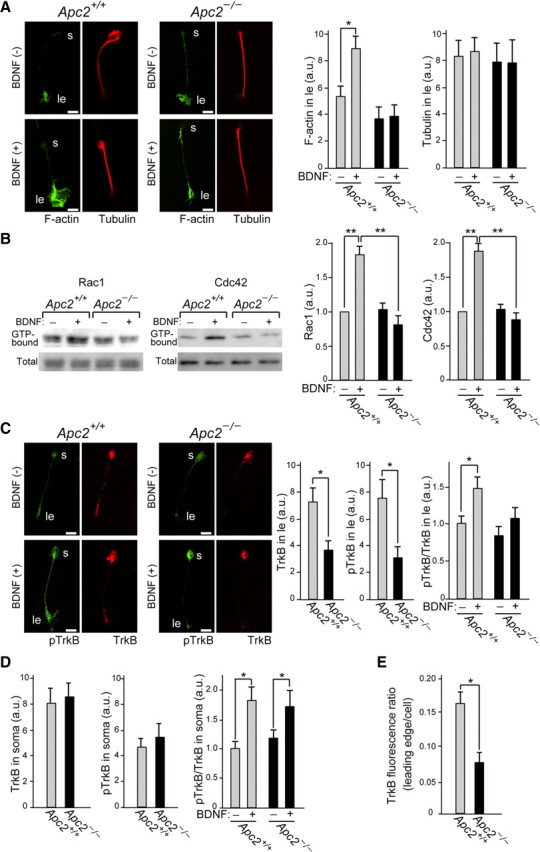
Figure 15.

Abnormal TrkB distribution and actin reorganization in Apc2-deficient CGCs. A, Distribution of F-actin (green) and microtubule (red). Before or after stimulation with a BDNF-gradient for 1 h, CGCs were stained with an anti-Tuj1 antibody and phalloidin. Quantification was performed by measuring the fluorescent intensity in the leading edge. s, cell soma; ld, leading edge. B, Western blot analyses of GTP-bound forms of Rac1 and Cdc42, and total Rac1 and Cdc42 in extracts of CGCs with or without 1 h BDNF-gradient stimulation. Signal intensities were quantified and summarized. C, Distribution of TrkB (red) and phosphorylated TrkB (green). Before or after stimulation with a BDNF-gradient for 1 h, CGCs were immunostained with anti-TrkB and anti-phosphorylated TrkB antibodies. Quantification was performed by measuring the fluorescent intensity in the leading edge. D, Quantification of immunohistochemical staining of TrkB and pTrkB in the cell soma. Values are shown as the mean ± SEM E, Ratio of TrkB fluorescent intensity at the leading edge to the total cellular TrkB fluorescent intensity. Values are shown as the mean ± SEM. The asterisk indicates a significant difference between the two values by Student's t test (A, C–E) or ANOVAs (B) (*p < 0.05, **p < 0.01). Scale bars, 5 μm.
