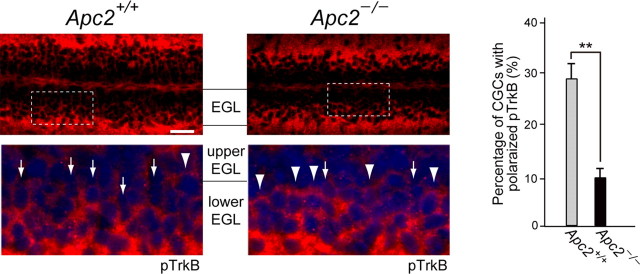
Figure 16.
Distribution of pTrkB in the inner EGL of cerebellar sections from P10 wild-type and Apc2-deficient mice. Sections were stained with an anti-pTrkB antibody (red) and DAPI (blue). Bottom, Enlarged images of the regions surrounded by dashed lines in upper panels. Arrows and arrowheads indicate representative CGCs with and without pTrkB polarization, respectively. Quantification was performed by calculating percentage of CGCs with pTrkB polarization. Values are shown as the mean ± SEM. The asterisk indicates a significant difference between the two values by Student's t test (**p < 0.01). Scale bar, 25 μm.

