Figure 4.

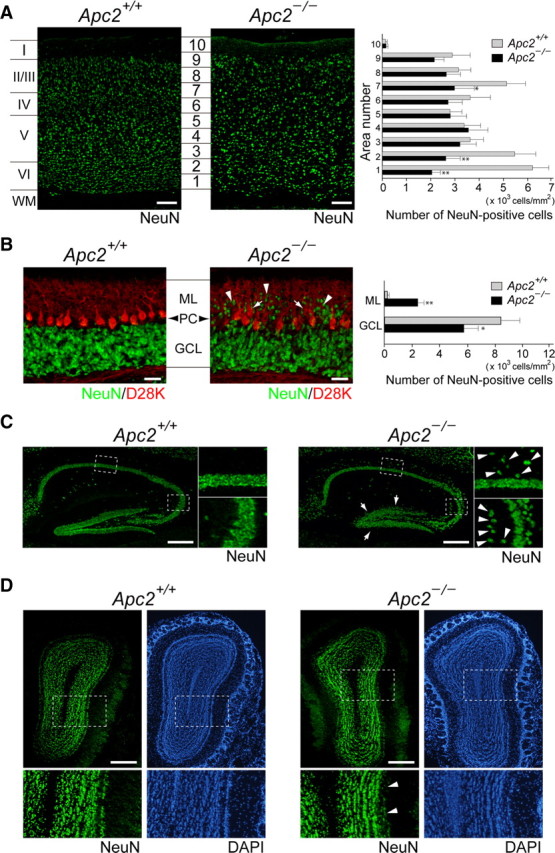
Morphological abnormalities in the brain of Apc2-deficient mice. A, Sagittal sections of P30 cerebral cortex stained with anti-NeuN (green, neuron-specific nuclear protein). Quantification was performed by measuring the distribution of NeuN-positive cells in each bin where the cortex was divided into 10 equal areas. The cell density of NeuN-positive cells in each area was plotted as histograms for wild-type (gray bars) or Apc2-deficient (dark bars) mice. Values are shown as the mean ± SEM. The asterisk indicates a significant difference between the two values in the same area by Student's t test (*p < 0.05, **p < 0.01). B, Sagittal sections of P20 cerebellum stained with anti-NeuN (green) and anti-calbindin D-28K (red). Arrows and arrowheads indicate ectopically distributed Purkinje and granule cells, respectively. Quantification was performed by measuring the distribution of NeuN-positive cells in the molecular layer (ML) and granule cell layer (GCL). The density of NeuN-positive cells in each area was plotted as histograms of wild-type (gray bars) or Apc2-deficient (dark bars) mice. *p < 0.05, **p < 0.01. PC, Purkinje cell layer. C, Sagittal sections of P30 hippocampus stained with anti-NeuN (green). Right, Enlarged images of regions surrounded by dashed lines in left panels. Arrows indicate ectopically distributed pyramidal cells, and arrowheads indicate broadening of dentate gyrus granule cells. D, Coronal sections of P30 olfactory bulb stained with anti-NeuN (green) and DAPI (blue). Bottom, Enlarged images of regions surrounded by dashed lines in upper panels. Arrowheads indicate diffusely distributed mitral cells. Scale bars: A, B, D, 50 μm; C, 100 μm.
