Figure 2.
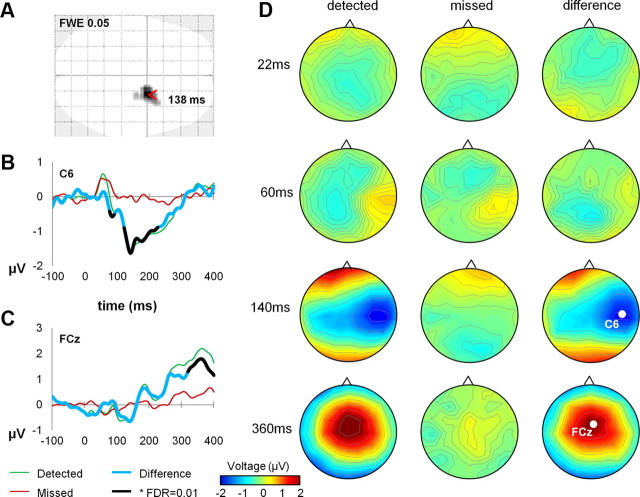
A, N140 component distribution. EEG responses showed late divergence for detected and undetected stimuli peaking at 135 ms within a central contralateral cluster (second-level paired t tests, corrected for multiple comparisons using FDR at αFDR = 0.05, qFDR = 0.02 peak level). B, C, ERPs characterizing tactile detection. N140 amplitude was largest at electrode C6. A broadly distributed P300-like component peaked at electrode FCz. D, Topographical maps. Grand-averaged voltage distributions are shown on topographical maps for detected and missed targets at four latencies corresponding to typical somatosensory ERP components (N20, P60, N140, and P300, respectively).

