Figure 3.
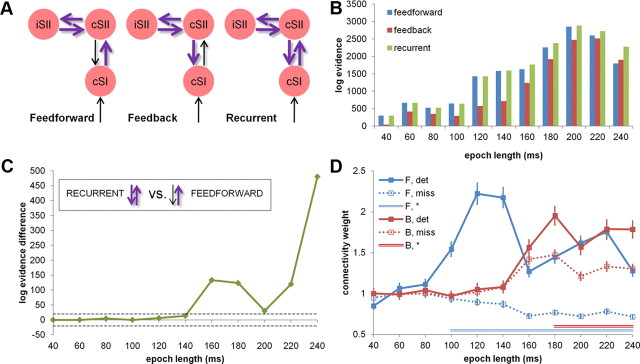
DCM. A, Structural DCMs. Individual dipole locations representing cSI and cSII/iSII were used to construct a structural model with three patterns of modulation by stimulus detection, representing feedforward, feedback, and recurrent processing between cSI and cSII. B, Model evidence. Models were compared using BMS for 11 data segments (plotted log-evidence difference against null model). C, Relative model evidence. Both recurrent and feedforward models explained data equally well for data segments <120 ms (log-evidence difference < 5). For longer data segments (>140 ms), the recurrent model was winning in all comparisons (very strong evidence > 5; dashed gray line). D, Connection strength across data segments. The feedforward connection (cSI–cSII, shown in blue) was stronger (100% posterior probability) after aware stimulus detection for data segments >80 ms (BMA, fixed effects). The feedback connection (cSII–cSI, shown in red) was stronger after detection for longer data epochs (>160 ms, 100% posterior probability), although the relative strength differences between conditions were less pronounced than for the feedforward connection. F, Forward; B, backward; det, detected; miss, missed. Asterisk marks significance.

