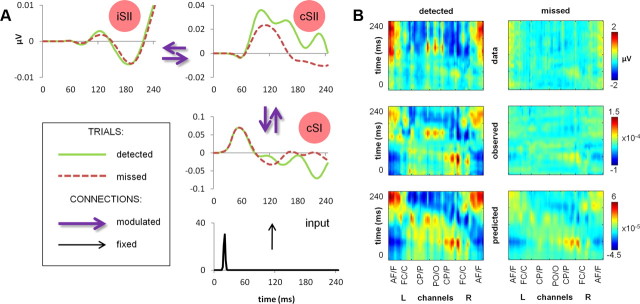
Figure 4.
DCM output of the recurrent model. A, Source activity estimates. Summary of the mean estimated activity at dipole level in the winning (recurrent) model (n = 19). B, Comparison of data and DCM output. Grand-averaged ERPs (n = 19) at all channels for detected (left column) and missed (right column) stimuli, plotted as (1) scalp data (top row), (2) DCM-observed responses, projected from scalp data onto eight spatial modes accounting for the greatest amount of explained variance and backprojected into channel space (middle row), and (3) DCM-predicted responses of the recurrent model, backprojected into channel space (bottom row). L, Left; R, right; AF/F, anteriofrontal/frontal; FC/C, frontocentral/central; CP/P, centroparietal/parietal; PO/O, parietooccipital/occipital.

