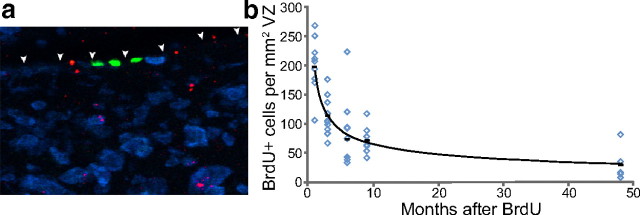
Figure 8.
The number of BrdU-positive ventricular zone cells declines with survival time after BrdU injection. a, BrdU-positive ventricular zone cells were identified by a green BrdU-positive nucleus embedded in the ventricular surface above HVC (shown with arrowheads). Three positive cells, all negative for the blue Hu neuron stain, can be seen in this example. Red spots represent microspheres retrogradely transported from an injection into RA. b, There is a nonlinear decrease in the number of BrdU-positive ventricular zone cells as the survival time after BrdU injection increases, which most likely represents continuing division of the BrdU-positive progenitors after the time of initial labeling. Each data point represents the average of left and right ventricular zone counts for each bird. Group means are shown as black bars. The trend line represents the regression line through the group means and has the equation y = 190x−0.5 (R2 = 0.99).

