
Figure 2.
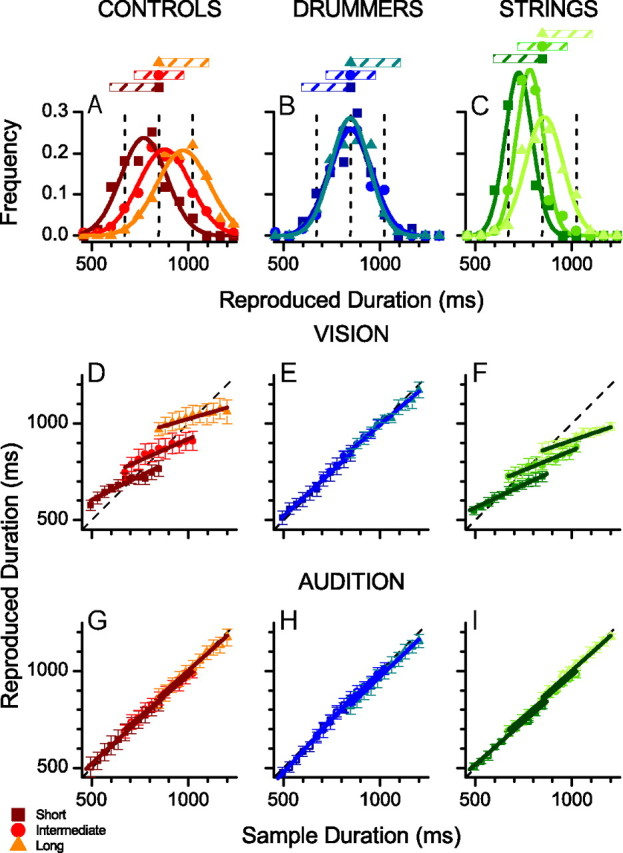
A, Reproduction distribution of visual stimuli for nonmusical controls for the duration 850 ms during sessions where the intervals were drawn from short (squares, 494–847 ms), intermediate (circles, 671–1024 ms), or long (triangles, 847–1200 ms) intervals. B, C, As in A, for expert drummers (B) or bowstring musicians (C). D, Average reproduction durations of visual stimuli for subjects without musical training as a function of stimulus duration for three stimulus ranges (squares, 494–847 ms; circles, 671–1024 ms; triangles, 847–1200 ms). Straight lines show best-fitting linear regressions over each range. The central tendency index is given as the difference between the slope of these fits and the equality line (dashed). E, F, As in D, for expert drummers (E) and bowstring musicians (F). G–I, As for D–F, except for auditory rather than visual stimuli. Here all subjects performed veridically (on average).