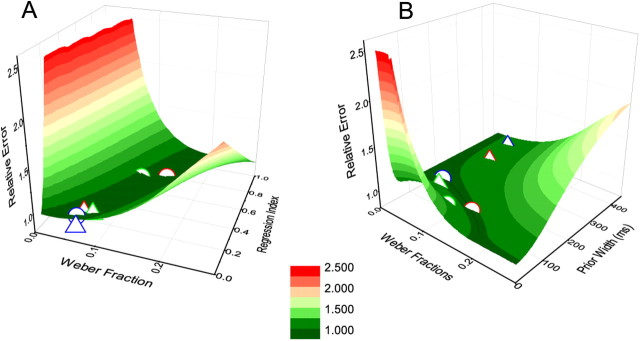
Figure 4.
A, B, Error landscapes showing relative RMS error for Weber fractions plotted against regression index (A) or width of the prior, σp (B). The points show the average data for our subjects (circles, vision; triangles, audition; blue, drummers; green, string musicians; red, controls). All points lie in the minimal-error valley, indicating that their behavioral choices are near optimal and adaptable. Note that A is a generic solution for any mechanism that causes a regression toward the mean, while B refers specifically to the Gaussian-prior model of variable width.

