
Figure 8.
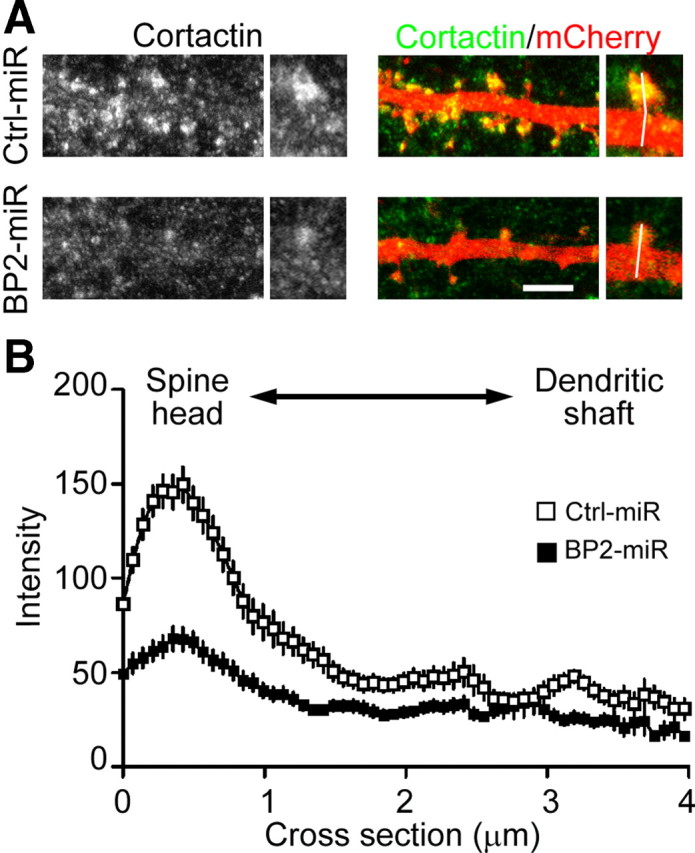
Knockdown of CTTNBP2 reduces the dendritic spine distribution of cortactin. Cultured rat hippocampal neurons were transfected with Ctrl-miR(mCherry) or BP2-miR(mCherry) at 12 DIV and fixed for staining at 18 DIV using cortactin antibody. Cortactin was visualized by Alexa Fluor 488. mCherry signals were used to outlined neuronal morphology. A, Representative images of the distribution of cortactin along dendrites. The 3-pixel-width lines in the enlarged images indicate the paths for line scanning, which start from the tip of dendritic spines and then cross the dendritic shaft. Scale bar, 5 μm. B, Quantitative analysis of cortactin distribution by line scan. More than 35 spines collected from seven neurons were analyzed for each group. The means ± SEM of fluorescence intensity along the path from dendritic spine to dendritic shaft are provided.