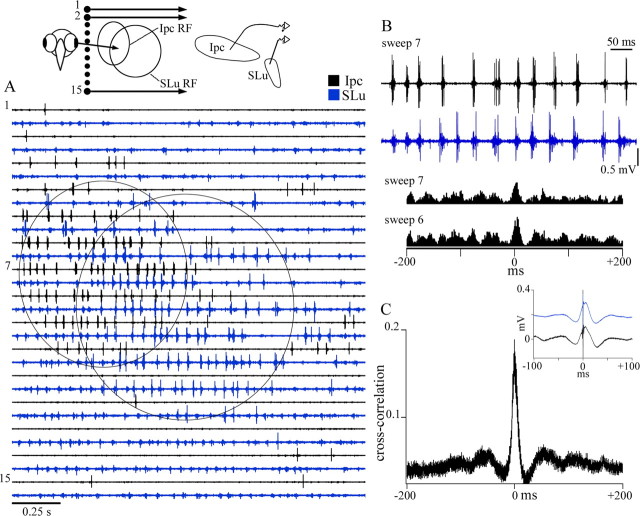
Figure 4.
Synchrony of visual responses between the Ipc and SLu. A, Simultaneous extracellular multiunit recordings in the Ipc and SLu, showing the tight coupling of the bursting responses in the Ipc and the spikes in the SLu, in response to a bright spot (1.7 deg visual angle) sweeping the screen monitor, from top to bottom, in 15 horizontal sweeps separated by 2 deg, at 15 deg/s (see schematics above). The circles outline the partially overlapped RFs of the Ipc and SLu. B, Expansion of recording traces corresponding to sweep # 7 (top) and cross-correlograms obtained for 12 repetitions of the indicated sweeps (bottom). Correlograms were computed from 0.5 s recording segments in the overlapped portion of the RFs. C, Mean cross-correlograms obtained for 14 paired Ipc/SLu recordings. Before averaging, correlograms for each recorded site were divided by the number of Ipc spikes. Therefore, the y-axis represents the probability of getting one spike in the SLu in a 1 ms bin for a given spike in the Ipc. The width of the correlogram represents the SEM. Inset, STAs of unfiltered samples of simultaneous Ipc (top) and SLu (bottom) records using the respective spikes as trigger events. Spikes in both nuclei ride synchronously on the ascending phase of a slow positive wave.

