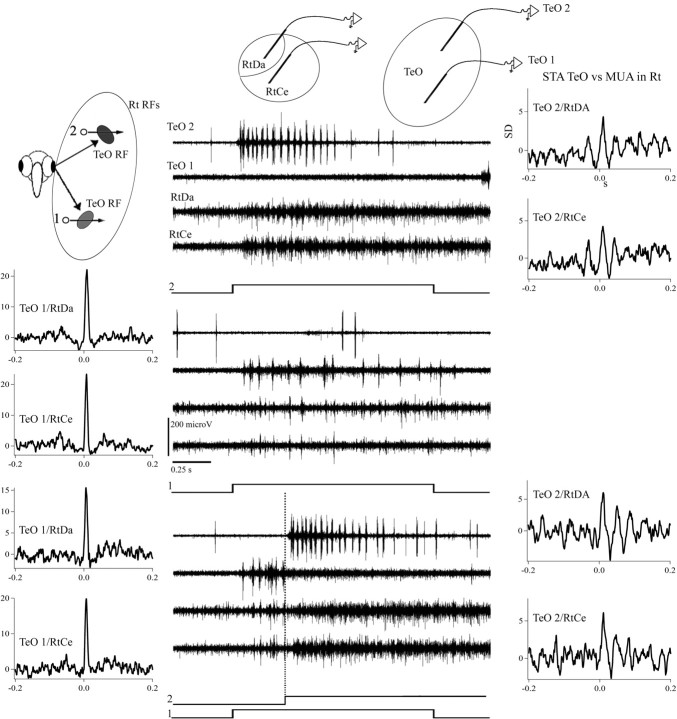
Figure 9.
The Rt synchronizes to the “winning Ipc feedback” in the TeO. Each of the three panels shows four recording traces corresponding to the simultaneous extracellular recordings of the Ipc bursting feedback in two separate sites in the TeO (TeO 1 and TeO 2) and the MUA recorded in two subdivisions in the Rt. Note that the large RFs in the Rt include the smaller RFs recorded in the TeO. Top, Moving a light spot through the TeO 2 RF produces a strong bursting discharge in that site synchronized to the MUA activity recorded in the RtDa and RtCe (right correlograms). Middle, Moving a light spot through the TeO 1 RF produces a strong bursting discharge in that site synchronized to MUA activity recorded in the RtDa and RtCe (left correlograms). Bottom, Overlapped stimulation of both tectal RFs produces the suppression of bursting discharges in TeO 1 and the activation of bursting discharges in TeO 2, which is manifested in corresponding changes in the discharge profile in both Rt subdivisions: to the left of the dotted line marking the beginning of the second stimulus, both Rt subdivisions synchronize with TeO 1 (left correlograms), to the right of the dotted line, both subdivisions synchronize with TeO 2 (right correlograms). Velocity of both stimuli is 8.2 deg/s.

