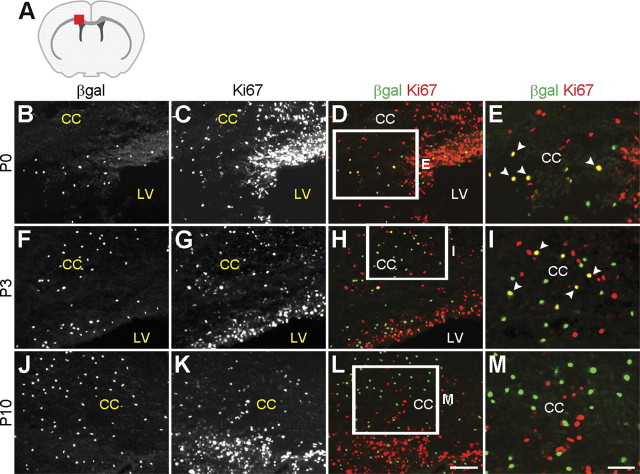
Figure 5.
Correlation between Runx1 expression and postnatal microglia proliferation. A, Schematic of the forebrain in the coronal plane demonstrating the location (red square) of the area examined in B–M. B–M, Coronal sections of Runx1LacZ/+ brains collected at the indicated postnatal stages were subjected to double-labeling analysis of β-gal and Ki67 expression. Boxes in D, H, and L indicate areas shown at higher magnification in E, I, and M. Arrowheads indicate cells coexpressing β-gal and Ki67. Numerous β-gal+ cells express Ki67 at P0, but this correlation is lost in older animals. CC, corpus callosum; LV, lateral ventricle. Scale bars: (in L) B–D, F–H, J–L, 100 μm; (in M) E, I, M, 50 μm.

