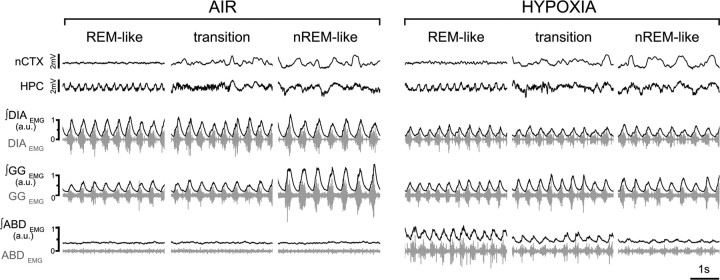
Figure 5.
Hypoxic response across brain states. EEG (nCTX and HPC) and EMG (DIA, GG, and ABD; raw traces in gray; rectified and integrated EMG traces in black) in control (left) and during hypoxia (13.3% O2; right) in REM-like, transition, and nREM-like epochs. Note the state-dependent potentiation of ABDEMG activity and the lack of state-dependent modulation of GGEMG during nREM-like epochs under hypoxia (n = 8).

