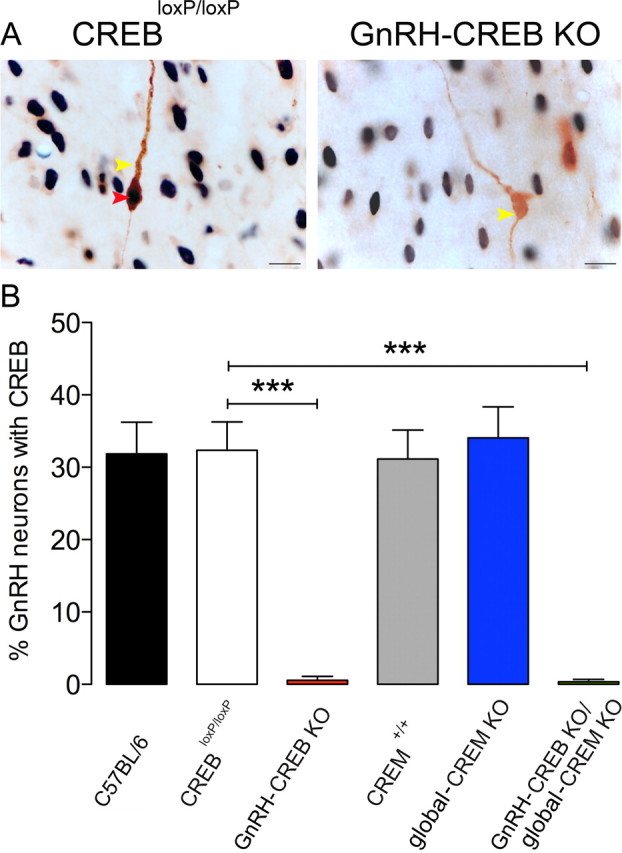
Figure 1.

A, CREB expression in CREB mutant mouse line. The photomicrographs show nuclear CREB immunoreactivity (black nuclei, red arrowhead) in GnRH neurons (brown cytoplasm, yellow arrowhead) in CREBloxP/loxP mouse and lack of CREB expression in GnRH neurons (brown cytoplasm, yellow arrowhead) in GnRH-CREB KO mouse. Scale bars, 10 μm. B, Histogram shows the percentage of GnRH neurons expressing CREB in control (C57BL/6, CREBloxP/loxP, CREM+/+), GnRH-CREB KO, global-CREM KO, and GnRH-CREB KO/global-CREM KO mice. The histogram shows the means (+SEM); n = 7–14. ***p < 0.001 (ANOVA with Tukey's post hoc test).
