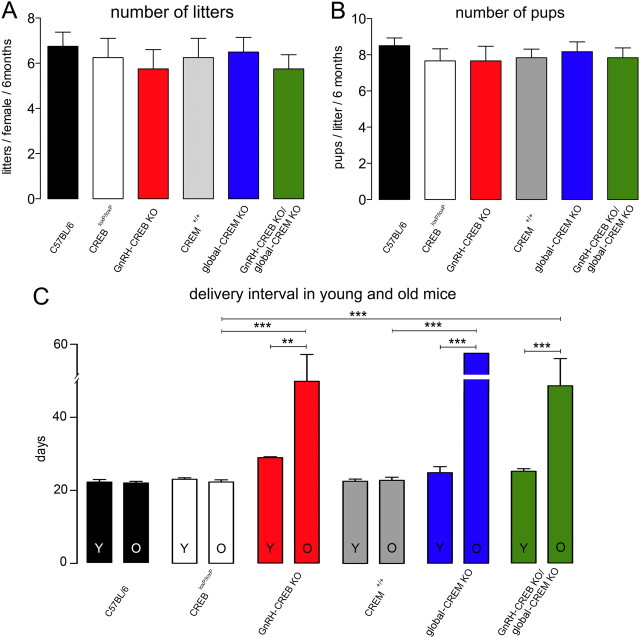
Figure 4.
Fecundity of CREB mutant female mice. A, B, The histograms show the mean (+SEM) number of litters (A) and number of pups/litter (B) born to mutant and control female mice per 6 months. C, The delivery intervals in young (Y; first 6 months of testing) and old (O; after 6 months of age) mice are given for each of the six genotypes (n = 4–6). **p < 0.01; ***p < 0.001 (ANOVA with Tukey's post hoc test).

