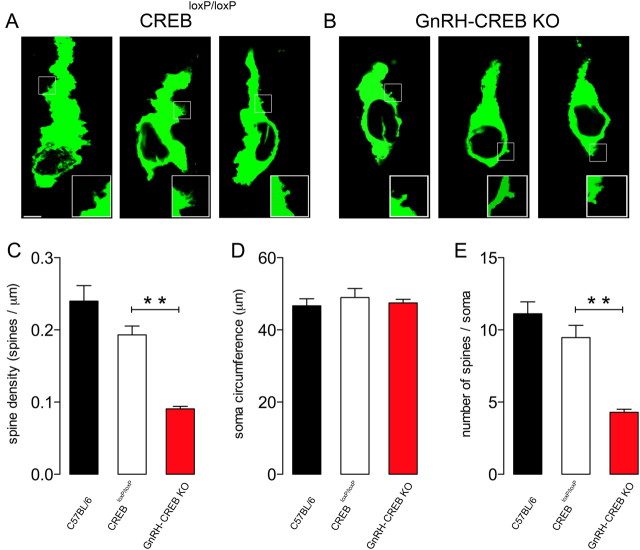
Figure 6.
Somatic spine density of GnRH neurons in CREB knock-out mice. A, B, Confocal stacks (400 nm optical thickness) of GnRH-immunolabeled neurons from CREBloxP/loxP (A) and GnRH-CREB KO (B) mice. Insets, Typical somatic spines are shown in confocal stacks from corresponding white boxes in GnRH neurons in A and B. Scale bar, 5 μm. C–E, Spine densities for the somata (C), soma circumferences (D), and numbers of spines on GnRH neurons (E) of control (C57BL/6, CREBloxP/loxP) and GnRH-CREB KO mice. The histograms show the means (+SEM); n = 4–6. **p < 0.01 (ANOVA with Tukey's post hoc test).

