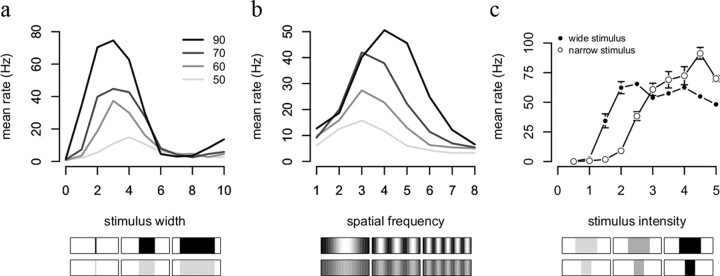
Figure 6.
Receptive field properties. a, Single unit response rates to stimuli of different widths centered on the units' predictive field. Gray values code contrast level as indicated in the legend. The peak response is at wider stimuli for low contrast, indicating a larger field of spatial integration. b, Frequency preference depends on stimulus contrast. Instead of blobs with increasing widths, here we used full field stimulation with sinusoidally modulated luminance patterns. c, Contrast response function depends on stimulus width. The network was stimulated by a narrow (3 receptors) and a wide stimulus (9 receptors) of increasing contrasts.

