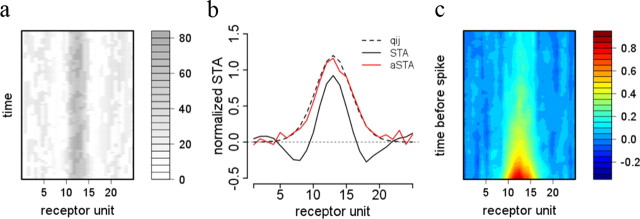
Figure 7.
Measuring predictive fields. a, Adapted stimulus superimposing the naive STA and the checkerboard stimulus. Gray value indicates stimulus intensity, details are given in Materials and Methods. b, True predictive field (dashed line), the naive estimate (plain black line) and the estimate resulting from the adapted stimulus (red line). c, Full spatiotemporal STA using the adapted stimulus.

