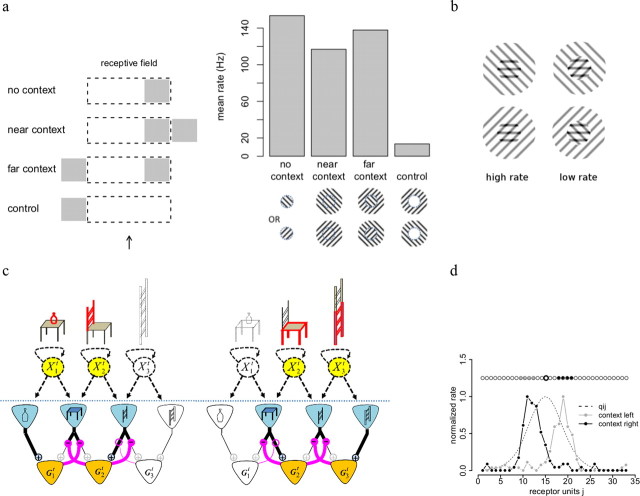
Figure 8.
Reshaping of receptive fields by spatial context. a, A detector stimulated in the right part of its receptive field (dashed lines, RF center indicated by the black arrow) is suppressed by stimuli in the right surround (gray rectangle), but unaffected by stimuli in the left surround. Left panel shows stimulation protocol and right panel shows mean firing rates during the test stimulus for 250 repeats. b, Targeted divisive inhibition predicts nonseparable interactions between center and surround. The effects of a surround grating on the response to a central plaid yield stronger response to the plaid and the surround than to the plaid alone if the surround is coaligned with the overlaid nonpreferred grating (left column) and weaker if not (right column). c, Illustration of selective divisive inhibition. Depending on which other objects are present in the scene (circular nodes highlighted in yellow), the seat of a chair will be either discounted (left) or useful as a distinctive feature (right). This is implemented by a selective inhibition (magenta connections) of feedforward inputs by detector responses. Active receptor neurons and detector neurons are highlighted in blue and orange, respectively. Thick lines indicate active connections, while thin lines represent connections that are not in use (because presynaptic neuron is inactive) or suppressed by divisive inhibition. d, Application to the blob model. A subset of units (context, gray and black dots) is clamped to indicate high probability of the corresponding objects. Together, these units predict firing rates for all the receptor units. This prediction selectively inhibits the feedforward inputs from receptor units to other detector units. Plain gray and black lines show the resulting (shifted) tuning curves for the unit indicated by the thicker circle. Dashed line indicates the predictive field for this unit.

