Figure 9.
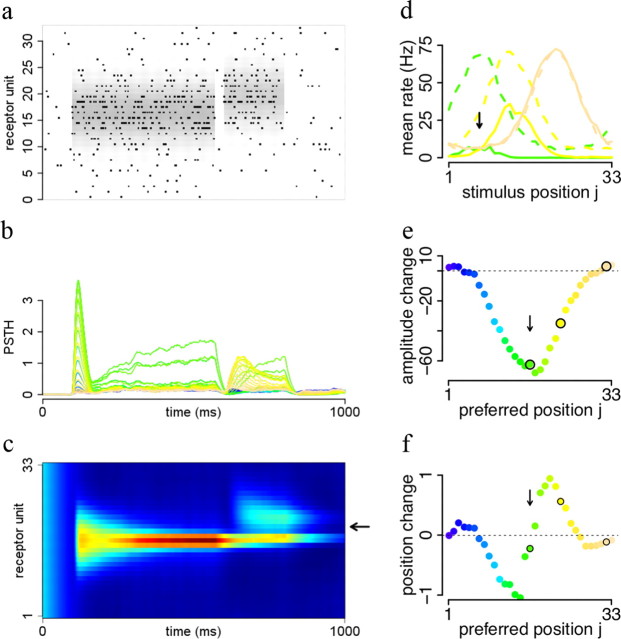
Reshaping of receptive fields by temporal context. a, After an adapting stimulus, a test stimulus at a slightly different position is shortly presented and the number of spikes during test stimulus presentation counted. Black dots indicate spikes for a single run and gray values in the background indicate firing rates of the corresponding receptors. b, Smoothed PSTH for all cells in the network for multiple repetitions of the stimulus in a. Each colored line corresponds to the PSTH of one cell in the network. c, Illustration of the repulsion effect: the adapting stimulus causes the peak network response (intensity values show mean G values) to be shifted away from the test stimulus (black arrow). d, Adaptation changes tuning curves. Colored lines show tuning curves of three different units after exposure to a stimulus indicated by the black arrow. Dashed lines show unadapted tuning curves for comparison. e, Change in peak amplitude depends on distance between adapting and preferred stimulus. f, Preferred position of cells changes depending on distance between adapting and preferred stimulus.

