Figure 3.
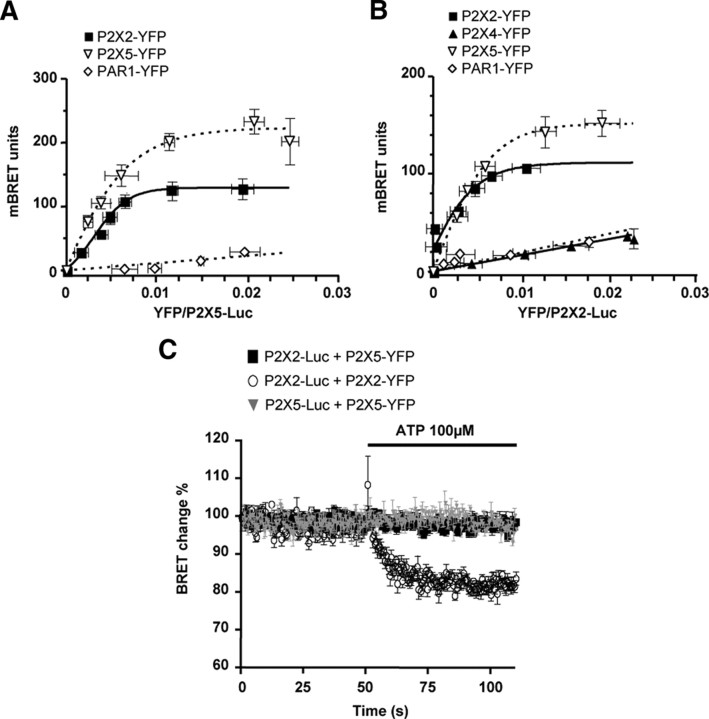
P2X5 subunits are in close spatial proximity to P2X2 subunits. A, BRET titration curves using P2X5-Luc as the energy donor. HEK cells were cotransfected with a constant amount of P2X5-Luc and with an increasing amount of YFP fusions. BRET signals are plotted against the relative amounts of each tagged subunit. Specific, saturating, BRET signals are observed between P2X5 and P2X2, or P2X5 subunits, while low linear BRET is obtained with PAR-1. B, BRET titration curves using P2X2-Luc as the energy donor, with experiments performed as described above. Specific BRET signals are observed between P2X2 and P2X2 or P2X5 subunits, but not P2X4 and PAR-1. Data are expressed as mean ± SEM of at least N = 3 experiments. C, Cytosolic domains of P2X2/5 and P2X2 receptors undergo differential conformational changes after ATP stimulation. Dynamic BRET signals were recorded after ATP stimulation (100 μm) in HEK cells transfected with P2X2, and P2X5 subunits carrying either a luciferase (Luc) or YFP tag on their C terminus tail, alone or in combination. ATP stimulation induced a diminution of BRET signal between P2X2 subunits, which is not observed for P2X2/5 and P2X5 receptors. Representative experiment reproduced three times. Data are mean ± SEM of triplicate.

