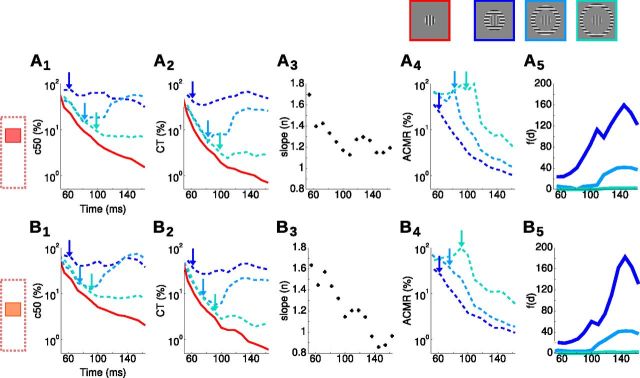
Figure 6.
Dynamics of surround influence on center contrast response function. We plot the dynamics of five parameters extracted from the Equation 4 fit, averaged in two different regions of interest [central (A) and more peripheral (B), see left-hand icons] and three surround positions (blue color-code). A1–B1, Dynamics of c50. A2–B2, Dynamics of CT. A3–B3, Dynamics of n. A4–B4, Dynamics of ACMR. A5–B5, Dynamics of the f(d). Arrows point at latency of responses to the three different surround-only stimuli.

