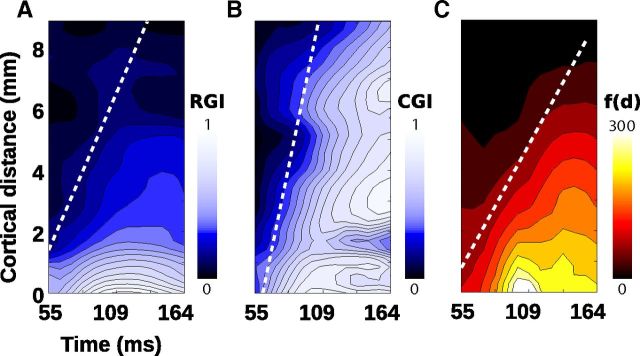
Figure 7.
Surround-induced propagation of normalization and suppression. Different components of the surround propagation controlling the central CoRF are shown along the unified metric introduced in Figure 4F. A, B, Propagation of response and contrast suppression: spatio-temporal maps of the RGI (see Fig. 5C) (A) and CGI (see Fig. 5C) (B). The dotted line indicates regression line best-fit to the iso-contour of significant levels of RGI and CGI. C, Net peripheral input propagation: spatio-temporal map of the integral of f(d). The dotted line indicates the regression line best fitted to the iso-contour of significant levels of peripheral input strength.

