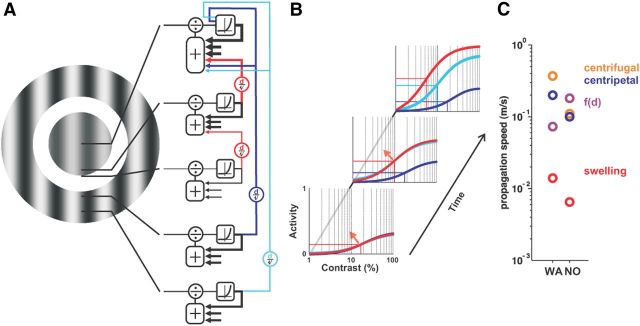
Figure 8.
Intracortical circuits implementing local input normalization and surround suppression. A, Schematic drawing illustrating both stimulus and the divisive normalization recurrent circuits implementing local input integration (in red) and surround suppression (in blue). Red and blue arrows depict horizontal spread of activity at a constant speed, v, over various distances. The normalization pool implementing local divisive normalization is transiently fed by polysynaptic recurrent intracortical activity (red), whereas surround suppression feeds both the normalization pool and the direct input to the cell (blue). B, Schematic dynamics of the contrast response function for the three conditions tested here: the central stimulus alone (red); a center stimulus with a close surround (blue); or a far surround (cyan). At the second and third time frames, the presence of a surround clamps the CoRF at the state it has reached, whereas center-only stimuli CoRFs continue to evolve (red arrow). C, Recapitulation of the various speeds measured for both monkeys. Color-coded legend shown on the right.

