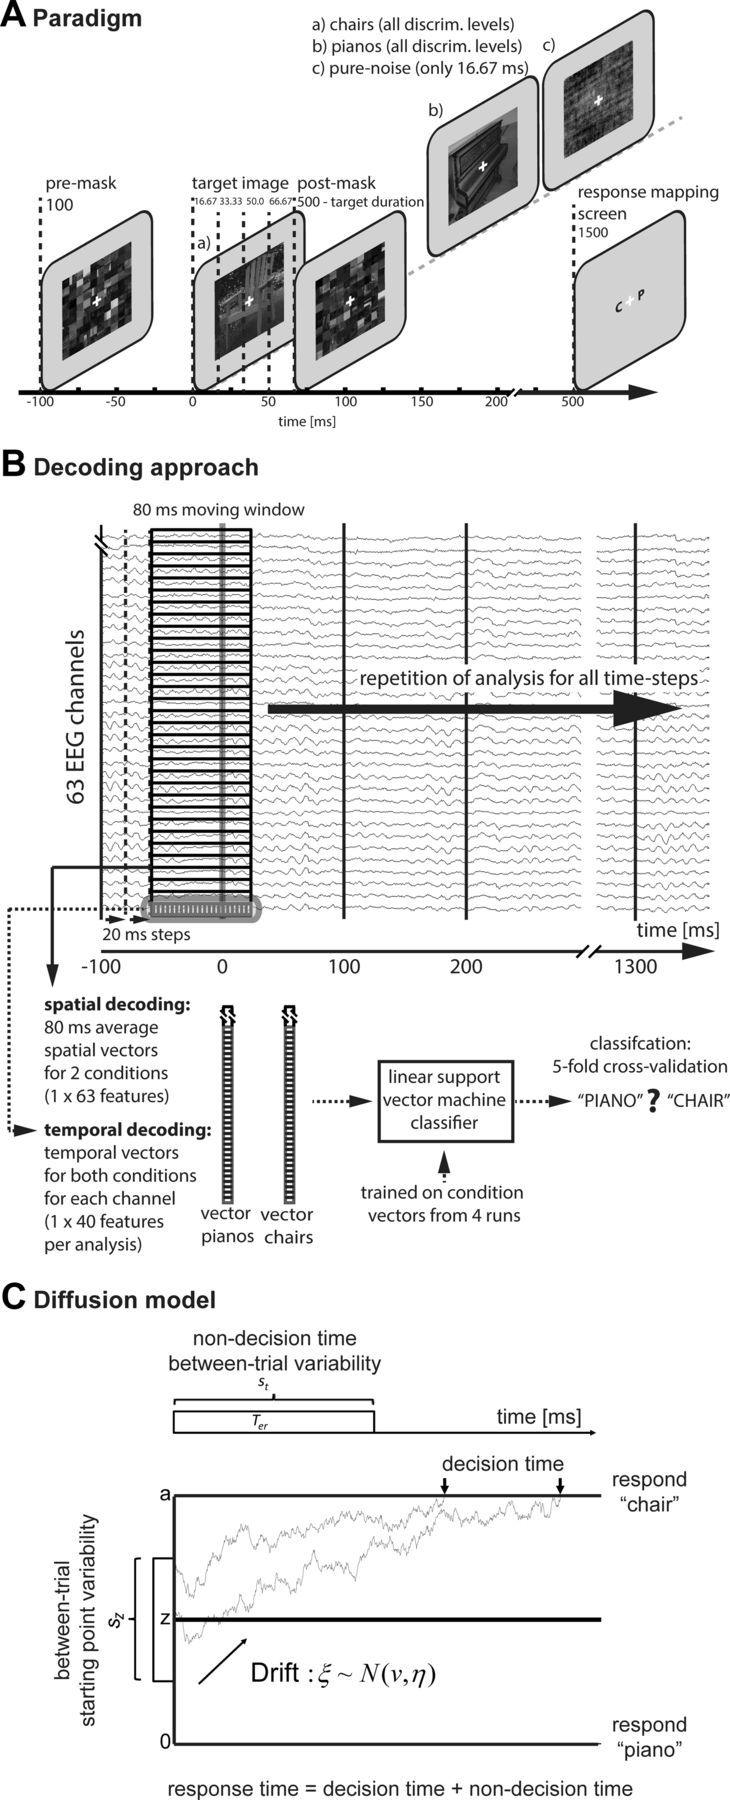
Figure 1.

Experimental paradigm and methodology. A, Paradigm. A scrambled premask was presented at −100 ms. At time point 0 ms the target image was presented, followed by a scrambled postmask. In each of the five runs, 24 piano images and 24 chair images as well as 48 pure noise images (16 ms only) were shown in each discriminability condition. Participants were asked to choose the category of the presented image (piano or chair). Response mapping screens were pseudo-randomized. B, Multivariate pattern classification. For spatial decoding, data from all 63 head electrodes for each time step within a given trial were averaged within a time window of 80 ms, resulting in two 63-dimensional spatial vectors (chairs, pianos) per time step and per trial. A linear support vector machine classifier was used for classification of each time step (20 ms moving time-steps) separately. The temporal classification analysis was identical but used all 40 data points within the 80 ms time window as features for separate analyses for each channel. C, The diffusion model decomposes observed response time into time required to make a decision, and time related to nondecision components of processing. The first choice boundary reached by the diffusion process determines the overt response. The time taken to reach the choice boundary determines the decision time. Accumulation of perceptual evidence for one or the other alternatives begins at z. The distance between the absorbing boundaries reflects criterion setting. Evidence accumulation is assumed to be inherently noisy. The mean rate of evidence accumulation on a given trial is determined by the drift of the diffusion process. Drift is assumed to be normally distributed across trials with mean v and standard deviation η. The starting point of the evidence accumulation process is assumed to vary according to a uniform distribution centered at z, with range sz. Two example evidence accumulation paths are shown. The difference in the starting points of the pathways is due to between-trial starting point variability. The highly irregular paths are due to within-trial noise in the accumulation process. The top part of the figure summarizes the nondecision components of overall RT. Non-decision time is modeled as a uniform distribution centered at Ter, with range st.
